

This guide covers self-managed PostgreSQL and ClickHouse on Linux. Exact defaults and behavior can vary with the kernel, distribution, filesystem, storage device, cgroup configuration, and database release. Treat example values as test inputs—not as production defaults. ClickHouse Cloud and other managed services may not expose these host controls.
Linux database tuning often starts with a number: vm.swappiness=10, vm.dirty_ratio=10, or some configuration block copied from a production blog post.
That is usually the wrong starting point.
The right question is not, “What is the best swappiness value for PostgreSQL?” It is:
Is the database losing performance because Linux is reclaiming anonymous memory, accumulating too much dirty page cache, forcing synchronous writeback, or because the database itself is using more memory and I/O than the host can safely provide?
Those are different problems. They need different fixes.
This guide explains how vm.swappiness, vm.dirty_background_ratio, vm.dirty_ratio, and their byte-based alternatives work on current Linux kernels. It then connects those controls to PostgreSQL checkpoints, WAL, work_mem, ClickHouse merges, query memory, external spilling, page cache, containers, and virtual machines.
The goal is not to give you a magical sysctl block. The goal is to give you a method you can defend in production.
Key takeaways
Click any topic to expand or collapse
vm.swappiness Relative Cost
vm.swappiness is a relative-cost control, not a percentage of RAM that Linux will swap.
Kernel Documentation & Scale
Current kernel documentation defines swappiness on a 0–200 scale, with a default of 60. Older guides that describe only 0–100 are outdated or incomplete.
Dirty Ratios & Background Writeback
vm.dirty_background_ratio starts background writeback; vm.dirty_ratio can make the process producing writes perform writeback itself.
Available Memory vs Physical RAM
Dirty ratios are based on available memory, not simply installed physical RAM.
PostgreSQL & ClickHouse Tuning Profiles
PostgreSQL and ClickHouse should not share a tuning profile by default. Their memory and write paths are different.
Metrics to Measure Before Tuning
Measure active swap, PSI, Dirty, Writeback, database memory, checkpoint or merge activity, and storage latency before changing values.
What vm.swappiness actually controls
vm.swappiness tells the Linux virtual-memory subsystem how it should weigh swap I/O against filesystem paging when it needs to reclaim memory. The current kernel documentation describes it as a rough relative I/O-cost control.
At the default value of 60, Linux does not mean “swap 60% of memory.” The value influences the balance between reclaiming file-backed pages, such as filesystem cache, and reclaiming swap-backed anonymous pages.
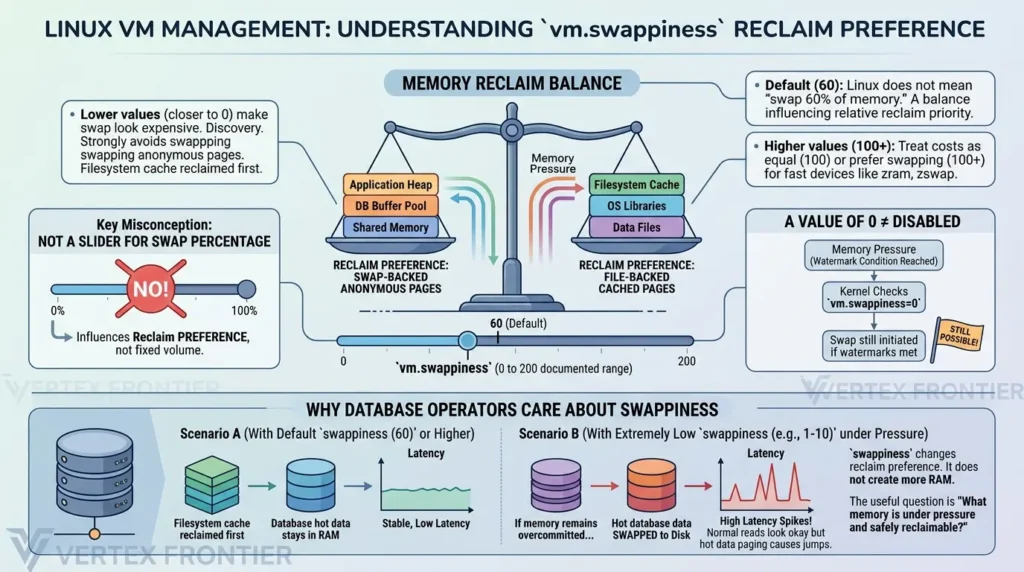
The current documented range is 0 to 200:
- Lower values make swap look more expensive relative to filesystem paging.
- A value of 100 treats the two costs as roughly equal.
- Values above 100 can make sense for unusually fast in-memory swap such as zram or zswap, or for a swap device that is faster than the relevant filesystem workload.
- A value of 0 does not mean that swap is permanently disabled. The kernel can still initiate swap under the documented watermark conditions.
That last point matters. A large number of database tuning articles still explain swappiness as a 0–100 “how aggressively to swap” slider. That model is easy to remember, but it is not an accurate description of the current kernel behavior.
Why database operators usually care about swappiness
Databases commonly keep important working data in anonymous memory, shared memory, memory-mapped regions, or allocator-managed buffers. If Linux swaps a hot part of that working set, latency can jump even when database-level read metrics look normal.
At the same time, setting swappiness extremely low does not create more RAM. It only changes reclaim preference. If the host is genuinely overcommitted, reducing swap activity can move the failure mode from slow paging to memory allocation failure or an OOM event.
That is why the useful question is not “Should I use 1 or 10?” It is “What memory is under pressure, and what can be reclaimed safely?”
| Signal or setting | What it tells you | What it does not tell you |
|---|---|---|
vm.swappiness | Relative preference between swap-backed and filesystem-backed reclaim. | That Linux will swap a fixed percentage of RAM. |
SwapFree or “used swap” | How much swap space is currently unused or previously occupied. | Whether the host is actively swapping right now. |
vmstat si/so | Swap-in and swap-out activity during the sample window. | Which process caused the pressure without process-level inspection. |
vm.dirty_ratio | When a writer may be forced to start writing dirty data itself. | A guarantee of sustained disk throughput. |
swappiness changes reclaim preference. It does not fix an undersized host, an unbounded query, or slow storage.
Dirty ratios: background writeback versus foreground throttling
Linux page cache lets applications write to memory first and flush data to storage later. That is useful, but it creates a queue of dirty pages: data that has changed in memory but has not yet been written back to disk.
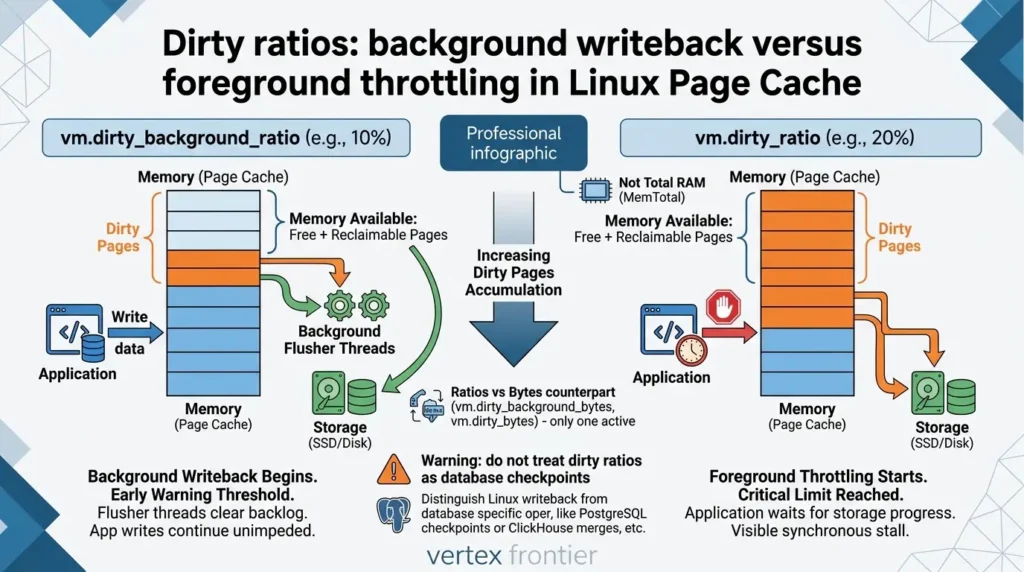
Two controls are commonly confused:
vm.dirty_background_ratio
This is the percentage of the kernel’s relevant available memory at which background flusher threads begin writing dirty data.
It is the early warning threshold. Once the threshold is reached, background writeback should begin working through the queue.
vm.dirty_ratio
This is the percentage at which the process generating disk writes can itself begin writing out dirty data. In practice, that means the application doing the write may be forced to wait for storage progress.
That distinction is operationally important. A high background threshold can allow a large dirty backlog to accumulate. A high foreground threshold can postpone the visible stall, then produce a much larger synchronous stall when the limit is finally reached.
The kernel documentation also states that these ratios are based on total available memory containing free and reclaimable pages. That is not the same as MemTotal and not the same as “RAM installed in the server.”
Linux writeback and PostgreSQL checkpoints are separate layers. ClickHouse merges and external spills are also separate layers. Raising a Linux dirty threshold cannot make a slow disk faster; it only changes how much dirty data can accumulate before pressure becomes visible.
Ratios versus absolute byte limits
Linux also provides:
vm.dirty_background_bytesvm.dirty_bytes
Each is the byte-based counterpart of a ratio setting. The kernel documentation states that only one member of each pair is active at a time. If you write a byte value, the corresponding ratio appears as zero when read, and vice versa.
Ratios scale with the machine’s available memory. That can be convenient on a fleet with similar workloads. It can also be dangerous on large-memory hosts, where a percentage represents a very large writeback queue.
Byte limits can be easier to reason about when you have a known storage queue, a strict latency budget, or a database host whose RAM changes between instance sizes. But a byte value is not automatically better. It still needs to be tested against write rate, storage bandwidth, filesystem behavior, and concurrent database activity.
Pre-flight checklist: what to record before tuning
Before changing a kernel value, write down the environment you are actually tuning. A database host is not just “a Linux server with 64 GB of RAM.” It is a specific kernel, storage path, memory boundary, workload, and concurrency pattern.
| Record | Why it matters | Example evidence |
|---|---|---|
| Kernel and distribution | Sysctl semantics and defaults can be version- and distro-sensitive. | uname -a, /etc/os-release |
| Deployment boundary | A VM or container may not own all visible host resources. | Bare metal, VM, cgroup v1/v2, memory limit |
| Database release | Memory settings, metric names, and documented behavior change over time. | PostgreSQL or ClickHouse version |
| Storage path | Writeback pressure depends on latency, throughput, queue depth, and filesystem. | NVMe, network block storage, HDD, RAID, filesystem |
| Workload window | A quiet host can hide the pressure that appears during checkpoints, merges, or batch jobs. | Peak traffic, bulk load, query burst, maintenance job |
If you cannot fill in these fields, treat the change as an investigation rather than a production tuning recommendation. The missing context is itself a risk signal.
Measure before changing anything
A safe tuning change starts with a baseline. Capture the host and database signals during the actual workload that produces the problem: a checkpoint, bulk load, ClickHouse merge, large aggregation, or traffic peak.
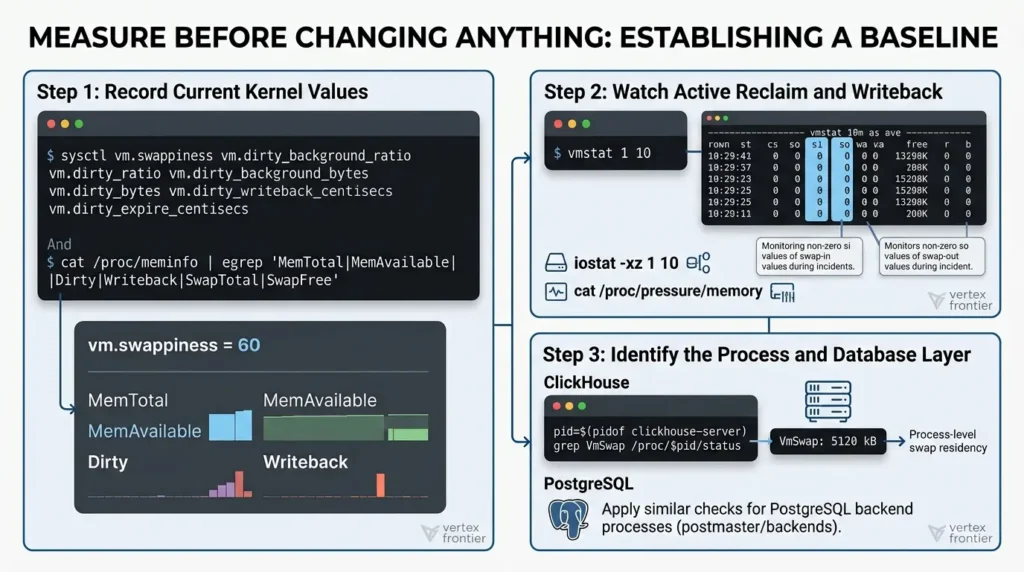
Step 1: record the current kernel values
Shell:
sysctl vm.swappiness \
       vm.dirty_background_ratio \
       vm.dirty_ratio \
       vm.dirty_background_bytes \
       vm.dirty_bytes \
       vm.dirty_writeback_centisecs \
       vm.dirty_expire_centisecs
cat /proc/meminfo | egrep 'MemTotal|MemAvailable|Dirty|Writeback|SwapTotal|SwapFree'
Do not be surprised if the byte-based values are zero while the ratio settings are non-zero. That usually means the ratio form is active.
Step 2: watch active reclaim and writeback
Shell:
vmstat 1 10
iostat -xz 1 10
cat /proc/pressure/memory
In vmstat, pay attention to:
si: swap-in rate.so: swap-out rate.wa: CPU time waiting for I/O.free: free memory, which should not be interpreted alone.b: blocked processes.
Sustained non-zero si or so during the latency incident is stronger evidence of active swapping than swap space merely showing as used.
The kernel’s /proc/meminfo documentation defines Dirty as memory waiting to be written back and Writeback as memory actively being written back. It also defines MemAvailable as an estimate of how much memory can be used to start applications without swapping. These fields are more useful than looking only at MemFree.
Step 3: identify the process and the database layer
For PostgreSQL, capture checkpoint, WAL, temporary-file, connection, and query concurrency data around the event. For ClickHouse, correlate OS data with memory tracking, merges, query logs, asynchronous metrics, and external-spill counters.
For a ClickHouse server, the operating system remains the source of truth for process swap residency:
Shell:
pid=$(pidof clickhouse-server)
grep VmSwap /proc/$pid/status
The same principle applies to PostgreSQL backends and the postmaster. Process-level swap residency can help separate a database memory problem from a co-located backup agent, log shipper, or other service.
PostgreSQL: tune the memory system, not just the kernel
PostgreSQL has several independent memory consumers. The most obvious one is shared_buffers, but it is not the whole picture.
The PostgreSQL resource configuration documentation explains that work_mem is a base maximum for an individual query operation such as a sort or hash table. A complex query can run several operations at once, and multiple sessions can do the same thing concurrently. Total memory can therefore be many times the configured work_mem value.
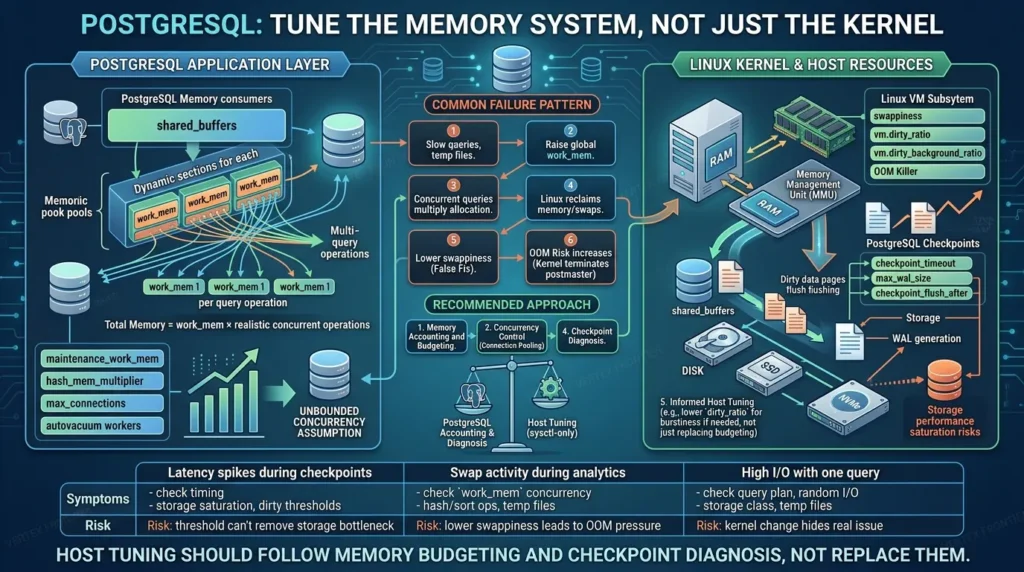
That creates a common failure pattern:
- A team sees temporary files or slow queries.
- It raises
work_memglobally. - Several concurrent queries multiply the allocation.
- Linux starts reclaiming memory or swapping.
- The team lowers swappiness and assumes the kernel was the original problem.
The kernel may be involved, but the first unsafe decision was often an unbounded concurrency assumption.
PostgreSQL checkpoints and Linux writeback
PostgreSQL checkpoints flush dirty data pages to disk. The official WAL configuration documentation notes that checkpoints can create a significant I/O load, which is why checkpoint writes are spread across the checkpoint interval.
This is why dirty-ratio tuning must be interpreted alongside:
checkpoint_timeout.max_wal_size.checkpoint_completion_target.checkpoint_flush_after.- Storage latency and throughput.
- WAL generation rate.
- Autovacuum and bulk-load activity.
If PostgreSQL is already smoothing checkpoint writes and the storage system is saturated, increasing Linux dirty thresholds may only create a larger backlog. If the host is forcing foreground writeback during a checkpoint, a carefully tested lower threshold, or a database-level change, may reduce burstiness. The answer depends on the observed shape of the workload.
PostgreSQL overcommit and OOM risk
The PostgreSQL kernel resources guide documents a Linux overcommit risk: under virtual-memory pressure, the kernel may terminate the PostgreSQL postmaster. PostgreSQL’s guidance discusses strict overcommit as one possible approach, but it also emphasizes controlling PostgreSQL memory and connection demand.
Do not use a lower swappiness value as a substitute for memory accounting. Check:
shared_buffers.work_memmultiplied by realistic concurrent operations.- hash_mem_multiplier.
maintenance_work_mem.max_connectionsand connection pooling.- Autovacuum workers and maintenance jobs.
- Replication, backup, and monitoring processes.
| PostgreSQL symptom | Check first | Why a sysctl-only fix is risky |
|---|---|---|
| Latency spikes during checkpoints | Checkpoint timing, WAL rate, storage latency, Dirty/Writeback, checkpoint_flush_after | Dirty thresholds cannot remove a storage bottleneck. |
| Swap activity during analytics | work_mem concurrency, hash/sort operations, temp files, active si/so | Lowering swappiness may turn paging into OOM pressure. |
| High I/O with one query | Query plan, random I/O, storage class, temporary files, memory allocation | A kernel change can hide the real query or storage issue. |
On PostgreSQL, host tuning should follow memory budgeting and checkpoint diagnosis, not replace them.
Memory Pressure Estimator: a planning tool, not a kernel recommendation
Before changing Linux reclaim settings, estimate whether the database configuration is already consuming most of the host’s memory budget. This calculator uses a deliberately simple model: PostgreSQL shared memory plus a rough concurrent work_mem allowance, maintenance memory, ClickHouse server memory, and other services.
It does not model every allocator, cache, kernel reservation, connection, merge, query plan, filesystem, or cgroup behavior. Use it to decide what to measure next, not to generate a production limit.
Enter approximate values. Use the same unit shown beside each field.
Planning estimate only. It is not a production-safe limit, benchmark, or recommendation for vm.swappiness, dirty ratios, swap size, or database settings.
This model intentionally treats work_mem × concurrent memory operations as a rough planning allowance. PostgreSQL can use several memory operations inside one query, while ClickHouse memory, page cache, merges, allocators, and background work do not fit neatly into a single number. That is why the calculator points back to measurement rather than producing a sysctl answer.
ClickHouse: separate OS swap from controlled spilling
ClickHouse has a different pressure profile. A large scan may compete with the filesystem page cache. Background merges consume CPU, memory, and disk bandwidth. Aggregations and sorts can use substantial memory, then spill to disk when configured to do so.
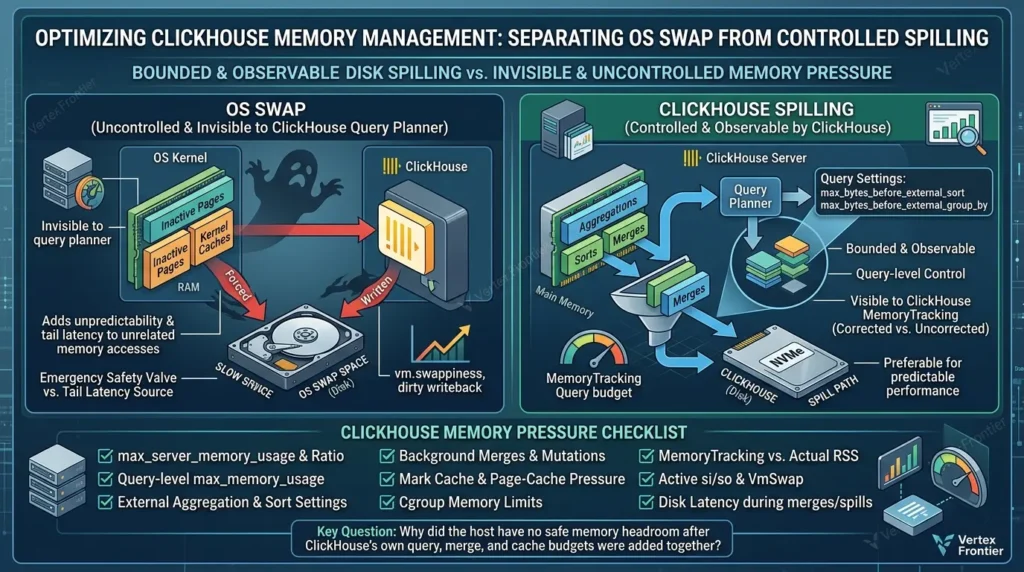
ClickHouse also exposes its own memory accounting. The official system metrics documentation describes MemoryTracking as tracked server memory, corrected by an external measurement when the background memory worker is enabled. MemoryTrackingUncorrected shows the allocation counter without those corrections.
Neither should be treated as a replacement for OS-level observation. If the kernel has swapped ClickHouse pages, inspect vmstat, /proc/<pid>/status, PSI, and /proc/meminfo.
OS swap is not the same as ClickHouse spilling
Controlled external aggregation or sorting is visible to ClickHouse and can be bounded by query settings. OS swap is invisible to the query planner and can add latency to unrelated memory accesses.
This distinction leads to a useful rule:
Prefer bounded, observable disk spilling over invisible, uncontrolled memory pressure, provided the storage path can handle it.
That does not mean “disable swap everywhere.” It means that for a latency-sensitive, dedicated ClickHouse host, you should decide deliberately whether swap is an emergency safety valve or an unacceptable source of tail latency.
The official ClickHouse OSS recommendations also cover broader host concerns: sufficient RAM, a current kernel, transparent_hugepage=madvise, and not disabling overcommit. Those are separate decisions from vm.swappiness and dirty writeback.
ClickHouse memory pressure checklist
Before changing swappiness, inspect:
max_server_memory_usageandmax_server_memory_usage_to_ram_ratio.- Query-level
max_memory_usage. - External aggregation and sort settings.
- Background merges and mutations.
- Mark cache and page-cache pressure.
- Co-located services.
- Cgroup memory limits.
MemoryTrackingversus actual process RSS.- Active
si/soand processVmSwap. - Disk latency during merges or external spills.
For ClickHouse, the question is often not “Why is Linux swapping?” but “Why did the host have no safe memory headroom after ClickHouse’s own query, merge, and cache budgets were added together?”
Decision tree: which layer should you tune first?
Use this short decision path before touching dirty ratios:
- Is
vmstatshowing sustainedsiorso? If yes, inspect processVmSwap, PSI, database memory, and cgroup limits before lowering swappiness. - Is Dirty or Writeback rising with disk wait? If yes, inspect storage throughput, checkpoints, merges, and write rate before raising dirty thresholds.
- Is database memory near its limit without active OS swap? Fix query memory, concurrency, spilling, or merge settings before changing kernel reclaim.
- Is the host quiet but the container pressured? Inspect cgroup memory and swap limits. Host-wide RAM is not the container’s budget.
- Is the database and host healthy except for one query or job? Tune the query, batch size, plan, or job concurrency before applying a host-wide policy.
This is a triage model, not an automatic prescription. It keeps the first change close to the layer that produced the evidence.
A practical tuning method: Observe, Change, Correlate, Roll Back
Use this four-stage method instead of copying a preset.
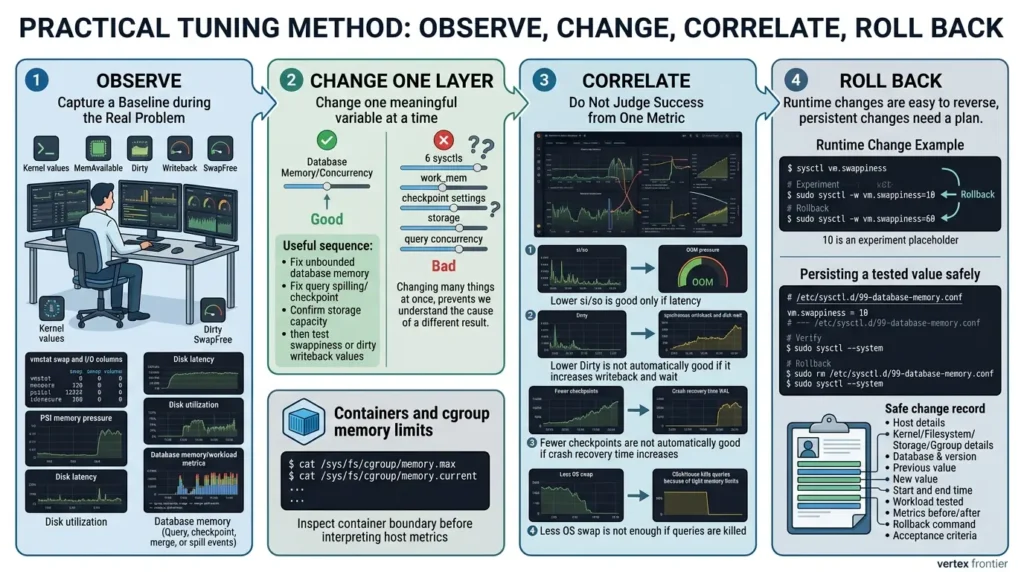
1. Observe
Capture a baseline during the real problem:
- Kernel values.
MemAvailable, Dirty, Writeback, SwapFree.vmstatswap and I/O columns.- PSI memory pressure.
- Disk latency and utilization.
- Database memory and workload metrics.
- Query, checkpoint, merge, or spill events.
2. Change one layer
Change one meaningful variable at a time. A useful sequence is often:
- Fix unbounded database memory or concurrency.
- Fix query spilling or checkpoint behavior.
- Confirm storage capacity and latency.
- Then test swappiness or dirty writeback values.
If you change six sysctls, work_mem, checkpoint settings, storage, and query concurrency together, you may get a different result, but you will not know why.
3. Correlate
Do not judge success from one metric. A successful change should improve the target symptom without creating a new one.
For example:
- Lower
si/sois good only if latency does not become OOM pressure. - Lower Dirty is not automatically good if it increases synchronous writeback and disk wait.
- Fewer checkpoints are not automatically good if crash recovery time or WAL retention becomes unacceptable.
- Less OS swap is not enough if ClickHouse now kills queries because memory limits are too tight.
4. Roll back
Runtime changes are easy to reverse, but persistent changes can survive reboots and become forgotten dependencies.
A safe change record should contain:
- Host, kernel, filesystem, storage, and cgroup details.
- Database and version.
- Previous value.
- New value.
- Start and end time.
- Workload being tested.
- Metrics before and after.
- Rollback command.
- Acceptance criteria.
Runtime change example
Shell — illustrative change and rollback:
# Record the current value first
sysctl vm.swappiness
Apply a temporary test value; choose the value from your experiment plan
sudo sysctl -w vm.swappiness=10
Roll back to the recorded value, for example:
sudo sysctl -w vm.swappiness=60
The value 10 above is an experiment placeholder, not a universal recommendation. The same rule applies to dirty ratios and byte limits.
Persisting a tested value safely
Do not edit a distribution’s main sysctl file blindly and do not make a runtime experiment permanent before it has passed your acceptance criteria. On systems that use systemd-sysctl, a separate file under /etc/sysctl.d/ is easier to review and remove.
Shell — persistence after validation:
# Create a clearly named, reviewable drop-in after testing
sudo tee /etc/sysctl.d/99-database-memory.conf > /dev/null <<'EOF'
# Chosen after a documented workload test; replace with approved values
vm.swappiness = 10
# Do not add dirty-ratio or dirty-byte values until they are tested
EOF
Apply and inspect the effective values
sudo sysctl --system
sysctl vm.swappiness
Roll back: remove the drop-in, then reload the remaining configuration
sudo rm /etc/sysctl.d/99-database-memory.conf
sudo sysctl --system
The example intentionally persists only swappiness. Do not copy the dirty-ratio comment as a recommendation. Add a dirty setting only after you have selected either the ratio pair or the byte pair, recorded the previous state, and defined a rollback test.
Containers and cgroup memory limits
A database inside a container may have a much smaller memory budget than the host. Host-level MemTotal can therefore make a tuning decision look safe when the cgroup is already near its limit. On cgroup v2 systems, inspect the container’s effective boundary before interpreting host memory metrics.
Shell — cgroup v2 inspection:
cat /sys/fs/cgroup/memory.max
cat /sys/fs/cgroup/memory.current
cat /sys/fs/cgroup/memory.events
cat /sys/fs/cgroup/memory.swap.max
If these paths are not available, identify the runtime and cgroup version first. Do not assume that a host-wide sysctl change controls the memory policy inside every container.
Profile-based guidance instead of magic numbers
| Host profile | Main risk | Prioritize | Avoid |
|---|---|---|---|
| Dedicated PostgreSQL OLTP on local SSD/NVMe | Tail latency during checkpoints or reclaim | Memory headroom, checkpoint metrics, storage latency, active swap | Global work_mem increases without concurrency math |
| ClickHouse query-heavy host | Query memory plus page-cache competition | Query limits, controlled spilling, memory tracking, PSI | Treating OS swap as a normal query-memory policy |
| ClickHouse ingest/merge-heavy host | Writeback and storage saturation | Merge activity, Dirty/Writeback, disk queue, storage capacity | Raising dirty thresholds to hide slow disks |
| VM with co-tenants | Noisy-neighbor memory or I/O pressure | Cgroups, PSI, steal time, process-level swap, isolation | Assuming the database owns all host memory |
| Container or cgroup-limited database | Host-wide ratios do not match the container budget | cgroup memory events, memory.current, memory.max, PSI | Using physical RAM as the only sizing input |
Three documented lessons from the field
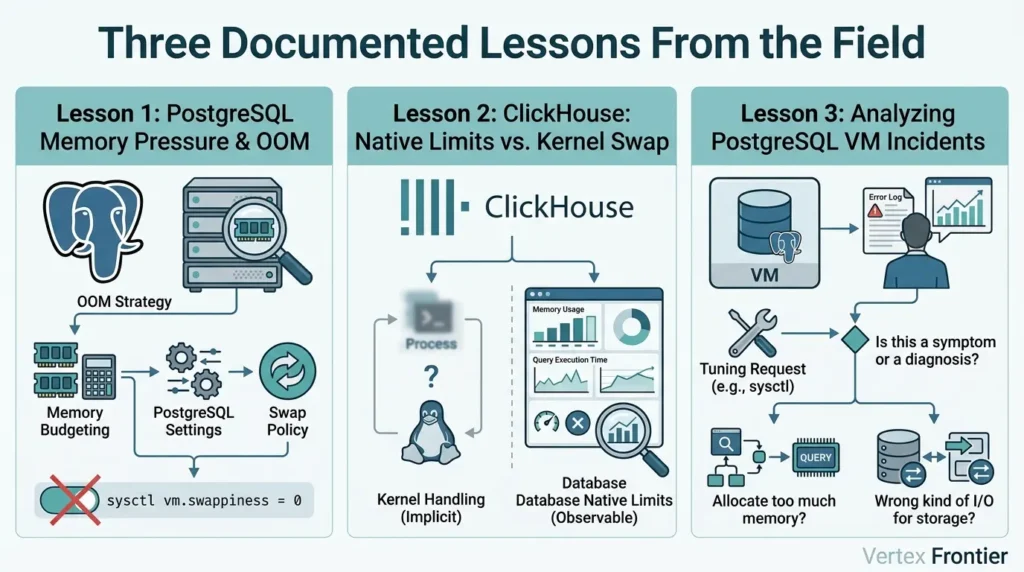
Case study 1: PostgreSQL memory pressure can look like a kernel problem
In the PostgreSQL documentation, the OOM scenario is explicit: Linux may terminate the PostgreSQL postmaster when PostgreSQL or another process exhausts virtual memory. The documented response is not “set swappiness to zero.” It includes controlling PostgreSQL memory, reducing dangerous settings when appropriate, reducing connection pressure, considering pooling, and evaluating overcommit and swap capacity. See the PostgreSQL kernel resources guidance.
Challenge: protect a PostgreSQL service from memory exhaustion.
Decision: treat host memory, PostgreSQL settings, connections, swap, and overcommit as one system.
Outcome: the official guidance defines a more robust mitigation path than a single sysctl value; it does not claim a universal performance result.
Lesson: swap policy is part of an OOM strategy, not a replacement for memory budgeting.
Case study 2: ClickHouse separates host memory from query controls
ClickHouse’s official documentation provides two relevant layers. Its self-managed usage recommendations address host conditions such as RAM, kernel freshness, THP, and overcommit. Separately, its memory-overcommit documentation describes a query-level mechanism that can wait and then stop a query when a memory limit is reached. The two layers solve different problems.
Challenge: keep analytical queries from consuming all host memory.
Decision: combine host-level headroom with database-level memory limits and, where appropriate, controlled spilling or query cancellation.
Outcome: the documentation describes controlled query behavior, not a guaranteed benchmark improvement.
Lesson: database-native limits are usually more observable than letting the kernel handle pressure invisibly through swap.
Case study 3: a real PostgreSQL VM incident points beyond sysctl values
A PostgreSQL high-I/O troubleshooting discussion on Reddit describes a virtualized workload with severe I/O and non-responsiveness. The discussion raised several possible causes: swapping, high work_mem multiplied across concurrent operations, virtualized storage behavior, and an overly optimistic random I/O cost assumption.
This is an older, anecdotal thread, not a controlled benchmark, but it captures an important production instinct: before changing kernel values, ask whether the workload is allocating too much memory or generating the wrong kind of I/O for the storage underneath it.
Lesson: a kernel tuning request may be a symptom report, not a diagnosis.
Common mistakes that make database tuning worse
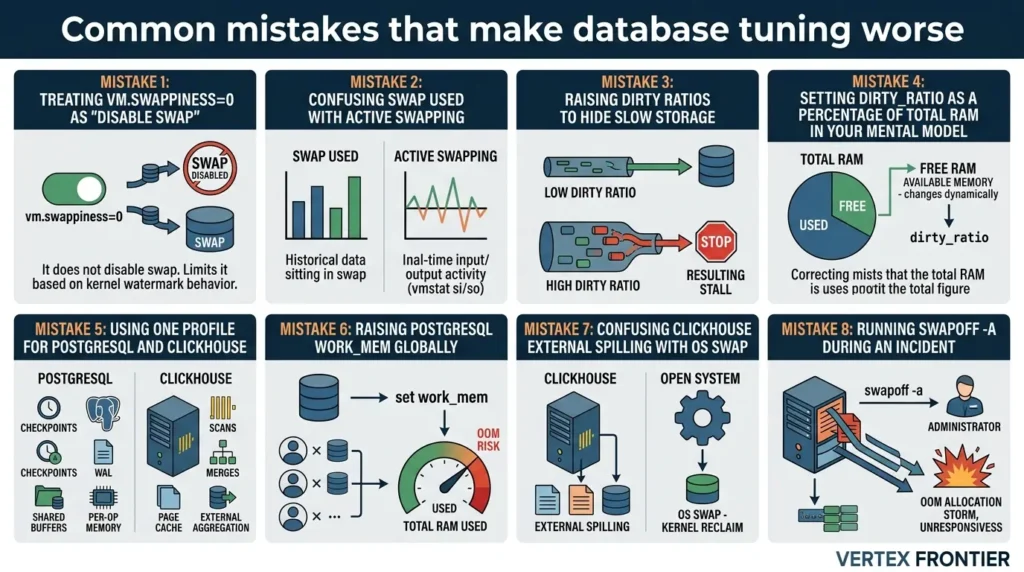
Mistake 1: treating vm.swappiness=0 as “disable swap”
It does not. The current kernel documentation describes a specific watermark behavior, not a permanent removal of swap.
Mistake 2: confusing swap used with active swapping
Previously swapped pages may remain in swap without current pressure. Check vmstat si/so, PSI, process VmSwap, and latency correlation.
Mistake 3: raising dirty ratios to hide slow storage
A higher threshold can allow a larger backlog. When the system finally needs to throttle writers, the resulting stall may be worse.
Mistake 4: setting dirty_ratio as a percentage of total RAM in your mental model
The kernel uses available memory, which changes with reclaimable memory and system state.
Mistake 5: using one profile for PostgreSQL and ClickHouse
PostgreSQL checkpoints, WAL, shared buffers, and per-operation memory do not behave like ClickHouse scans, merges, page cache, and external aggregation.
Mistake 6: raising PostgreSQL work_mem globally
work_mem is per operation, not a server-wide pool. Concurrency multiplies the risk.
Mistake 7: confusing ClickHouse external spilling with OS swap
External spilling is a database-controlled behavior. OS swap is kernel-level memory reclaim. Monitor and tune them separately.
Mistake 8: running swapoff -a during an incident
If substantial memory is already swapped out, forcing it back into RAM can create a sudden allocation storm and OOM risk. Treat swap removal as a planned change with enough free memory and a rollback plan.
Before and after: what a good tuning change looks like
A weak tuning change looks like this:
- Copy a sysctl block from an old article.
- Apply it to every database host.
- Observe that one graph moved.
- Keep it permanently.
A defensible change looks like this:
- Capture the incident window and workload.
- Confirm active swap or writeback pressure.
- Identify whether PostgreSQL, ClickHouse, or a co-tenant is responsible.
- Change one layer.
- Repeat the same workload.
- Compare latency,
si/so, PSI, Dirty, Writeback, disk wait, checkpoints, merges, memory, and errors. - Keep the change only if it improves the target symptom without creating a worse failure mode.
That workflow is less exciting than a magic number. It is also much more likely to survive the next workload change.
A compact operator worksheet
Use this table during a controlled test. It is intentionally a worksheet, not a calculator that invents a “safe” value from RAM alone.
| Field | Before | After | Acceptance rule |
|---|---|---|---|
| Kernel value | Record current sysctl | Record tested value | One major variable changed |
| Active swap | si/so, process VmSwap | Same measurements | No new sustained swap activity |
| Writeback | Dirty, Writeback, disk wait | Same measurements | No unacceptable foreground stalls |
| Database health | p95/p99 latency, errors, checkpoints/merges | Same workload window | Target symptom improves without a new failure mode |
| Rollback | Previous value and command | Rollback tested | Operator can reverse the change without guesswork |
If the test cannot meet an acceptance rule, do not preserve the new value merely because one graph improved. Return to the previous state and investigate the underlying memory, storage, or workload constraint.
Final checklist
Before publishing a kernel or database tuning change, confirm:
- The Linux kernel version and distribution are documented.
- The database version and deployment model are documented.
- The host is bare metal, VM, or container, and the memory boundary is known.
- Active swap is distinguished from historical swap use.
- Dirty and Writeback behavior is captured during the real workload.
- PostgreSQL memory concurrency or ClickHouse query/merge memory is accounted for.
- Storage latency and queue depth are measured.
- Only one major tuning variable is changed at a time.
- Runtime and persistent configuration are clearly separated.
- The rollback command and acceptance criteria are written down.
The most reliable database tuning advice is rarely a single number. It is a way to identify which layer is actually under pressure, change that layer carefully, and prove that the system improved without simply moving the failure somewhere else.
Related Vertex Frontier guides
If your workload moves data between PostgreSQL and ClickHouse, see Real-Time CDC from PostgreSQL to ClickHouse with Estuary Flow for the pipeline context. For ClickHouse merge and deduplication pressure, continue with ClickHouse ReplacingMergeTree Duplicates: Resolving CDC Deduplication Lag in Production. If replication and WAL behavior are central to the incident, Postgres CDC in Production: Handling Failover, Retries, and Duplicates provides the operational background.
FAQ: Linux swappiness and dirty ratios for PostgreSQL and ClickHouse
What is a good vm.swappiness value for PostgreSQL?
There is no universal value. Start by measuring active swap, memory pressure, PostgreSQL memory concurrency, storage latency, and OOM risk. A lower test value may be reasonable for a dedicated latency-sensitive host, but it should be validated against the possibility of memory exhaustion.
Does setting vm.swappiness=0 disable swap?
No. Current Linux kernel documentation says that zero prevents the kernel from initiating swap until free and file-backed pages fall below a zone high watermark. It is not the same as removing or disabling swap.
What is the difference between dirty_ratio and dirty_background_ratio?
dirty_background_ratio starts background flusher writeback. dirty_ratio is the higher threshold at which the process generating writes may be forced to write dirty data itself. The second condition can create application-visible stalls.
Should database servers use dirty ratios or dirty bytes?
It depends on the fleet and workload. Ratios scale with available memory; byte limits can be easier to reason about when the storage queue and latency budget are known. Linux treats each byte setting as an alternative to its ratio counterpart, so test the active form explicitly.
Why is ClickHouse slow when swap is used?
Swap can turn memory access into storage I/O and add tail latency. Confirm active swap with vmstat si/so, process VmSwap, PSI, and disk metrics. Also check whether ClickHouse query memory, merges, page cache, or a co-tenant consumed the available headroom.
Is ClickHouse external spilling the same as operating-system swap?
No. External spilling is controlled by ClickHouse query behavior and can be observed in ClickHouse logs and profile events. OS swap is managed by Linux and can affect process pages outside the query’s own accounting.
How can I tell whether Linux is actively swapping?
Use vmstat 1 10 and inspect sustained si and so activity. Then check process-level VmSwap, memory PSI, and latency. “Swap used” by itself may represent historical residency rather than current swapping.

Was this article helpful?




[…] and memory behavior under sustained CDC load is itself a host-level concern, see our Linux vm.swappiness and dirty ratios for PostgreSQL and ClickHouse] guide for how dirty writeback and swappiness interact with WAL retention and checkpoint […]