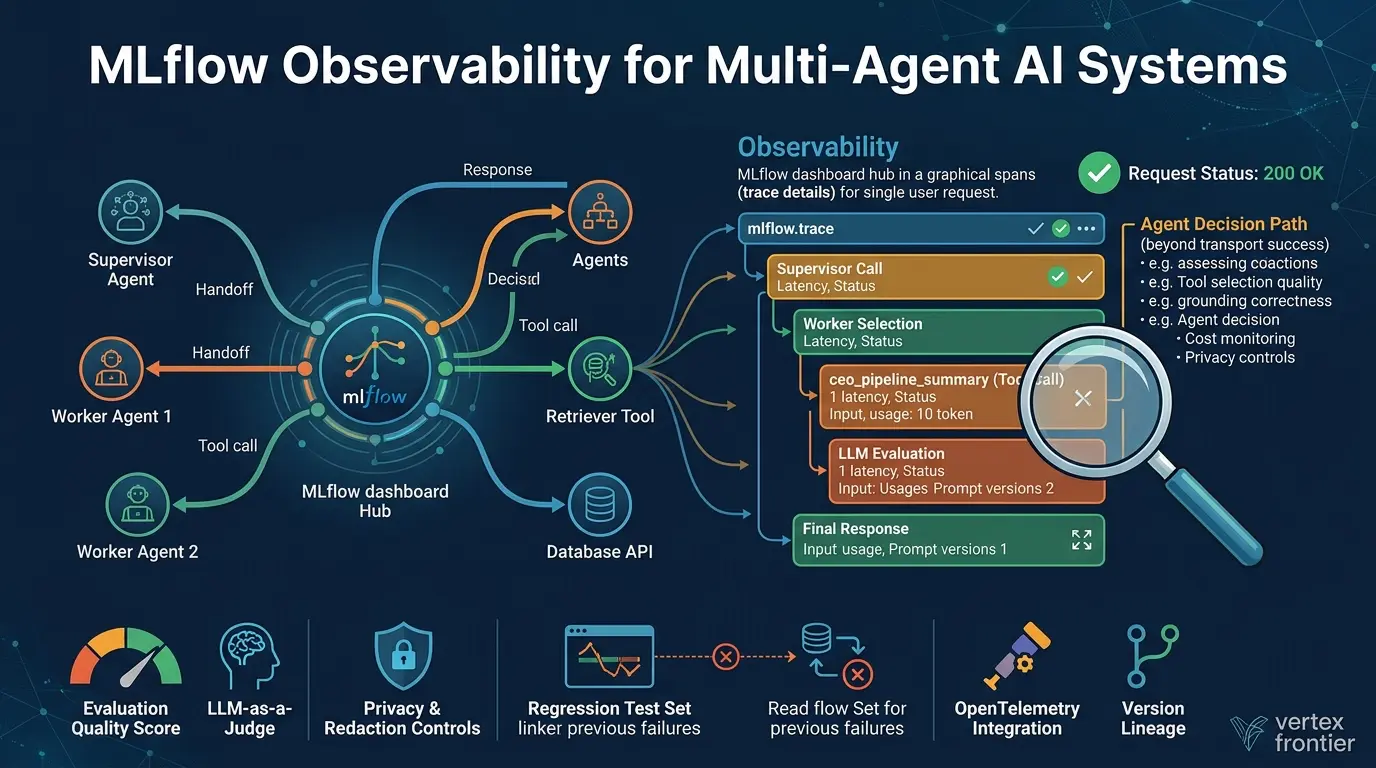

Your dashboard says the request succeeded. HTTP status: 200. Response time: 2.3 seconds. No exception, no timeout, no red alert.
Then a user reports that the agent gave them the wrong mortgage pipeline number.
That is not an unusual failure in a multi-agent application. It is the result of measuring the transport layer while ignoring the decision path. A request can be technically successful and still fail because an agent selected the wrong tool, used stale data, lost context between services, or produced a confident answer from an incomplete result.
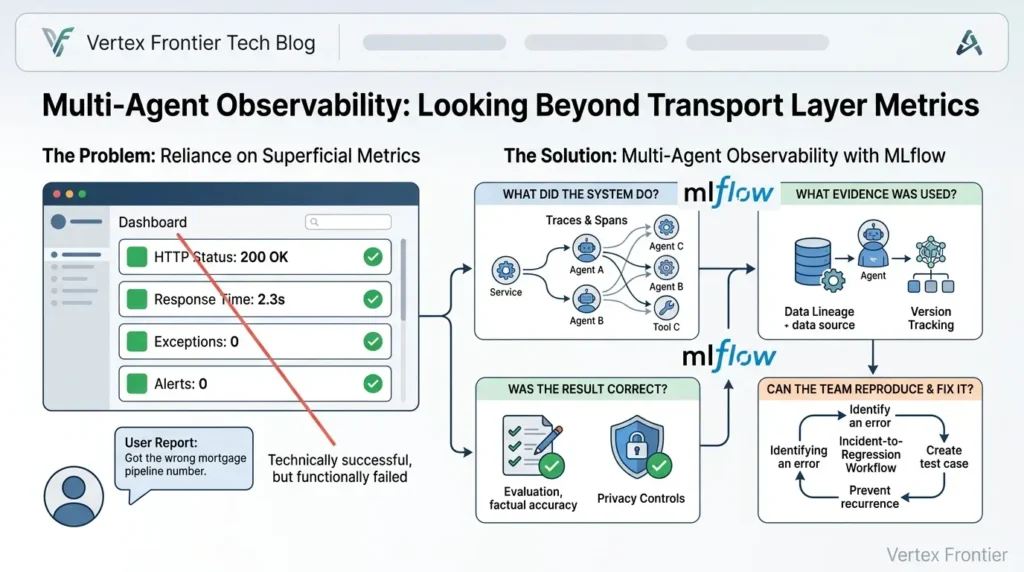
Multi-agent observability with MLflow is the discipline of making that decision path inspectable. It combines traces and spans with evaluation, version lineage, privacy controls, and an incident-to-regression workflow. The goal is not to collect every possible field. The goal is to collect enough trustworthy evidence to answer four questions:
- What did the system do?
- What evidence did each agent use?
- Was the result correct and safe for the task?
- Can the team reproduce, fix, and prevent the failure?
This guide develops that operating model with MLflow. It uses a documented mortgage-lending example, current MLflow documentation, production caveats, Google question signals, community implementation lessons, and a practical reference architecture. It does not treat a trace as proof of quality, and it does not treat an LLM judge as ground truth.
What this guide adds
Click any topic to expand or collapseA three-layer model
Execution evidence, quality evidence, and operational controls.
A production workflow
Covers supervisor/worker agents, tools, MCP, retrieval, and asynchronous services.
A practical evaluation boundary
Clear division between offline evaluation, online evaluation, and human review.
Technical caveats and implementation details
Covers sampling, token usage, manual spans, async logging, and tool-call scoring.
Practical diagnostic & operational tools
Includes a before-and-after diagnostic model, a metric contract, a cost calculator, and a launch checklist.
The short answer: what MLflow observability should cover
MLflow observability for a multi-agent system should cover more than model latency. At minimum, it should connect the user request to the agent route, handoffs, tool calls, retrieved evidence, model responses, quality scores, application version, and operational outcome.
A useful implementation has three layers:
| Layer | What it records | What it helps you decide |
|---|---|---|
| Execution evidence | Traces, spans, handoffs, tools, retrieval, model calls, latency, exceptions, tokens where supported | Where did the request go, and where did it fail? |
| Quality evidence | Deterministic checks, tool correctness, groundedness, relevance, safety, human feedback, regression results | Was the behavior acceptable for this task? |
| Operational controls | Context propagation, sampling, privacy, retention, access, version lineage, export, incident workflow | Can we trust, operate, and reproduce the evidence? |
This three-layer model is an editorial framework, not an MLflow product taxonomy. It matters because a trace can show that an agent called ceo_pipeline_summary; it cannot, by itself, prove that the returned number was current or that the final answer satisfied the business rule.
Pin the compatibility boundary before you publish
MLflow tracing and evaluation behavior can vary with the installed MLflow release, framework integration, model provider, deployment mode, and asynchronous execution model. A trustworthy implementation should make that boundary visible instead of presenting one successful notebook as universal production syntax.
Use the following matrix in the repository or article companion notes. Replace the placeholders only after running the exact workflow. “Not tested” is a useful status; it is safer than an invented compatibility guarantee.
| Boundary | Record | Status | Evidence to attach |
|---|---|---|---|
| MLflow package | Exact version and installation method | Not tested / Tested | Lockfile, command output, test date |
| Framework integration | LangChain, LangGraph, custom, or OTel-native path | Not tested / Conditional / Tested | Minimal reproduction and trace screenshot/export |
| Execution model | Sync, async, queue, or background job | Context preserved / Gap found | Trace-parent assertion across the boundary |
| Evaluation backend | SQL-backed deployment and dataset configuration | Supported / Not supported | Backend configuration and evaluation run |
| Model provider | Provider, model identifier, response metadata | Token data available / Unavailable | Redacted response and cost-calculation method |
| Data controls | Redaction, retention, access, external judges | Reviewed / Exception open | Data-flow review and policy decision |
If a row is “Conditional,” say what condition changes the result. This matrix is a verification template, not a claim that every combination is supported.
Request monitoring versus agent observability
Traditional application monitoring asks whether a request reached a service and returned a response. Agent observability asks what happened inside the request.
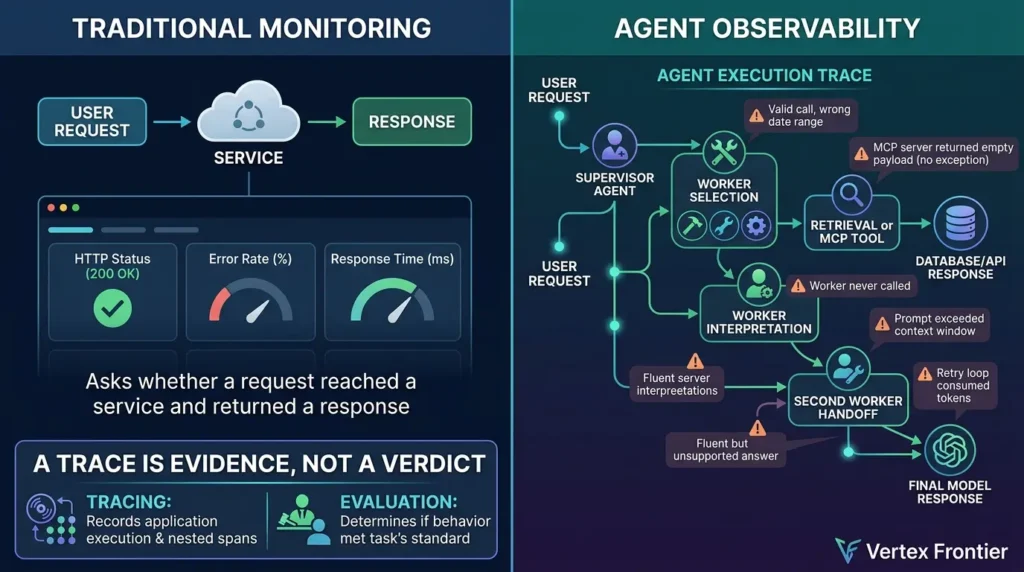
In a conventional API, the path might be straightforward:
request → database query → responseIn a multi-agent application, the path may look like this:
user request
user request
  → supervisor agent
    → worker selection
      → retrieval or MCP tool
        → database/API response
      → worker interpretation
    → second worker handoff
  → final model response
The difference is not cosmetic. A 200 OK can coexist with:
- a valid tool call that queried the wrong date range;
- an MCP server that returned an empty payload without raising an exception;
- a worker that was never called because the supervisor chose another route;
- a prompt that exceeded the useful context window;
- a retry loop that consumed tokens without improving the answer;
- a final answer that is fluent but unsupported by retrieved evidence.
The MLflow tracing documentation describes traces as records of application execution made up of nested spans. That gives engineers a structured view of the route, but the quality question still requires evaluation and domain-specific checks.
A trace is evidence, not a verdict
This is the first rule worth remembering:
Tracing tells you what the application recorded. Evaluation tells you whether the recorded behavior met the task’s standard.
If the system does not instrument a service, the trace cannot reveal its internal work. If an integration does not expose token usage, the span may not contain a reliable token count. If a tool returns sensitive records, automatically retaining the raw payload may be a privacy mistake rather than an observability improvement.
| Question | Traditional monitoring | Agent observability |
|---|---|---|
| Did the request return? | HTTP status and error rate | Also records the complete trace outcome |
| Which path did it take? | Often invisible | Parent-child spans and handoffs |
| Was the right tool used? | Usually not measured | Tool name, arguments, result, and scorer where available |
| Was the answer correct? | Not implied by 200 | Requires deterministic checks, judges, and/or human review |
A documented case study: the assistant was not hallucinating
A useful case study comes from the Red Hat walkthrough of AI observability with MLflow and its related multi-agent loan-origination quickstart.
The mortgage-lending reference application uses multiple agent personas, including a Prospector, Borrower, Loan Officer, Underwriter, and CEO Assistant.
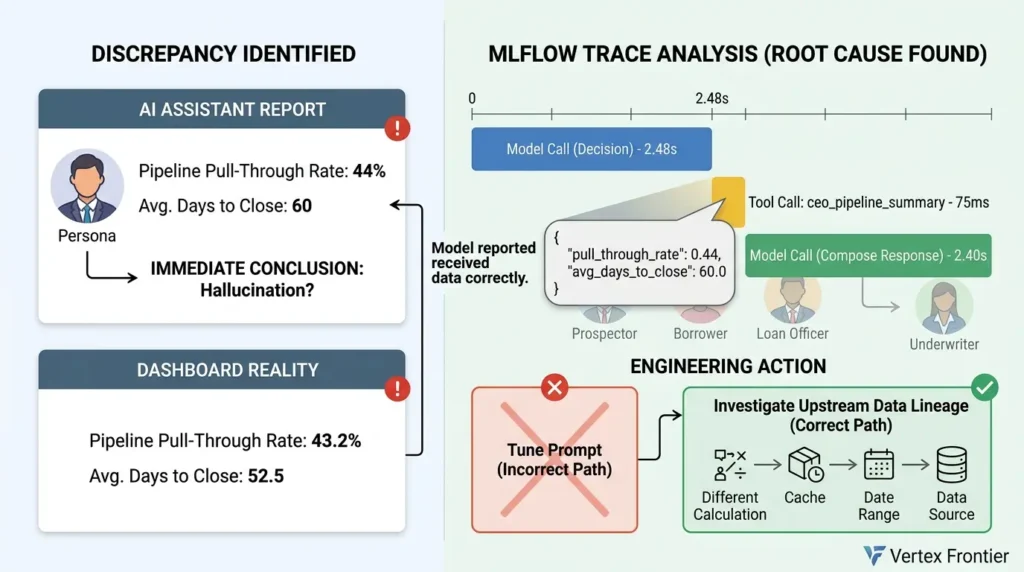
When asked to show the current pipeline status, the assistant reported a pull-through rate of 44% and an average of 60 days to close. The dashboard showed different values: 43.2% and 52.5 days.
Without a trace, the easy conclusion would be “the model hallucinated.” The trace provided a more useful answer. It showed:
- an initial model call taking 2.48 seconds to decide the next action;
- a
ceo_pipeline_summarytool call taking 75 milliseconds; - a second model call taking 2.40 seconds to compose the response.
The tool span’s raw payload already contained the 44% and 60-day values. The model had reported what it received. The likely defect was upstream of the final answer: a different calculation, cache, date range, or data source.
That distinction changes the engineering task. Instead of tuning a prompt because “the AI is wrong,” the team can compare the tool’s data source with the dashboard’s calculation.
The lesson is narrow but important: MLflow tracing can turn a vague model complaint into a concrete data-lineage investigation. It does not prove which source is authoritative; engineers still have to validate that boundary.
How MLflow traces and spans map to a multi-agent request
A trace is the record of one request or execution. A span is one operation within that trace. In a multi-agent workflow, useful span categories often include:
- root request;
- supervisor decision;
- worker handoff;
- LLM or chat-model invocation;
- tool or MCP call;
- retrieval query;
- database/API call;
- validation step;
- evaluator or judge call;
- final response.
The MLflow trace concepts documentation and GenAI semantic-convention documentation are useful starting points for deciding which attributes should be standardized in your own system.
A practical minimum context contract is:
| Field | Why it matters | Caution |
|---|---|---|
trace_id | Joins all work for one request | Preserve it across service boundaries |
span_id and parent ID | Reconstructs the execution tree | Async boundaries need explicit testing |
session_id | Groups related turns | Avoid using raw personal identifiers |
user_id or tenant key | Supports safe segmentation | Hash or pseudonymize where appropriate |
| application/version ID | Ties behavior to a release | Prompt version alone is incomplete |
| tool name and arguments | Explains route and intent | Redact secrets and sensitive values |
| latency and status | Identifies bottlenecks and failures | Measure missing spans too |
| token usage/cost | Supports economics | Availability depends on integration/provider |
Automatic instrumentation is helpful, not magical
For supported LangChain operations, MLflow documents automatic tracing through mlflow.langchain.autolog(). A minimal example looks like this:
Python — illustrative LangChain/LangGraph setup:
import mlflow
mlflow.set_experiment("mortgage-lending-agents")
mlflow.langchain.autolog()
result = mortgage_agent_graph.invoke({
"question": "What is the current pipeline status?"
})
The LangChain integration reference documents the supported integration surface. The safe interpretation is not “every internal operation is automatically visible.” It is “supported operations can be instrumented automatically, subject to the integration, version, execution model, and configuration.”
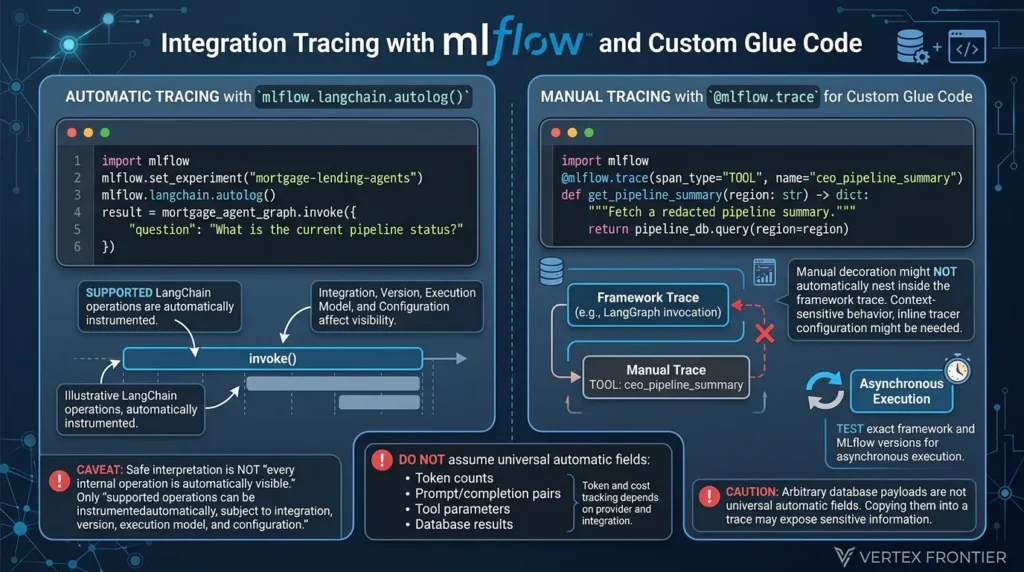
For custom glue code, MLflow also documents manual tracing with @mlflow.trace:
Python — custom tool span:
import mlflow
@mlflow.trace(span_type="TOOL", name="ceo_pipeline_summary")
def get_pipeline_summary(region: str) -> dict:
"""Fetch a redacted pipeline summary."""
return pipeline_db.query(region=region)
Do not assume that a manually decorated function will always nest inside the framework trace. The LangGraph integration documentation describes context-sensitive behavior, including cases where inline tracer configuration is needed. Test the exact framework and MLflow versions used by your application, especially around asynchronous execution.
Also avoid promising that every span automatically contains token counts, prompt/completion pairs, tool parameters, and database results. Token and cost tracking depends on the provider and integration. Arbitrary database payloads are not universal automatic fields, and copying them into a trace may expose sensitive information.
The production reference workflow: from request to regression test
The most useful upgrade to a conceptual observability article is a complete operating loop. A production workflow can be organized as follows:
- The API creates a root trace and safe session context.
- A supervisor chooses one or more workers.
- Each handoff preserves trace and parent context.
- Workers call tools, MCP servers, retrieval systems, and data services.
- Each important boundary records a meaningful span, status, latency, and redacted attributes.
- The final response is scored against task-specific criteria.
- A sampled production trace is reviewed automatically or by a human.
- A confirmed failure becomes an evaluation-dataset example.
- The next application or prompt version is tested against the regression set.
This loop is more valuable than a dashboard full of isolated latency charts because it preserves the connection between an observed failure and the engineering change intended to prevent it.
Multi-Agent Observability quick-start checklist
You do not need to instrument every field on day one. Start with the boundaries that let an engineer reconstruct one failed request and decide whether it deserves a regression test.
Pass condition: an engineer who did not write the workflow can follow one trace from request to tool result to evaluation outcome without asking the original author to reconstruct the story.
This checklist is intentionally smaller than a full production audit. It is a starting gate: if the team cannot satisfy these items, adding more dashboards may increase the amount of telemetry without increasing the amount of trustworthy evidence.
The Multi-Agent Observability Production Kit can package this checklist with a full incident-review template, metrics matrix, evaluation-dataset template, compatibility worksheet, and judge-cost worksheet. Use the in-article checklist first; download the full kit when you are ready to apply it across a team.
Download the free Production KitFree instant download — no signup required.
Evaluating agent quality: deterministic checks versus LLM judges
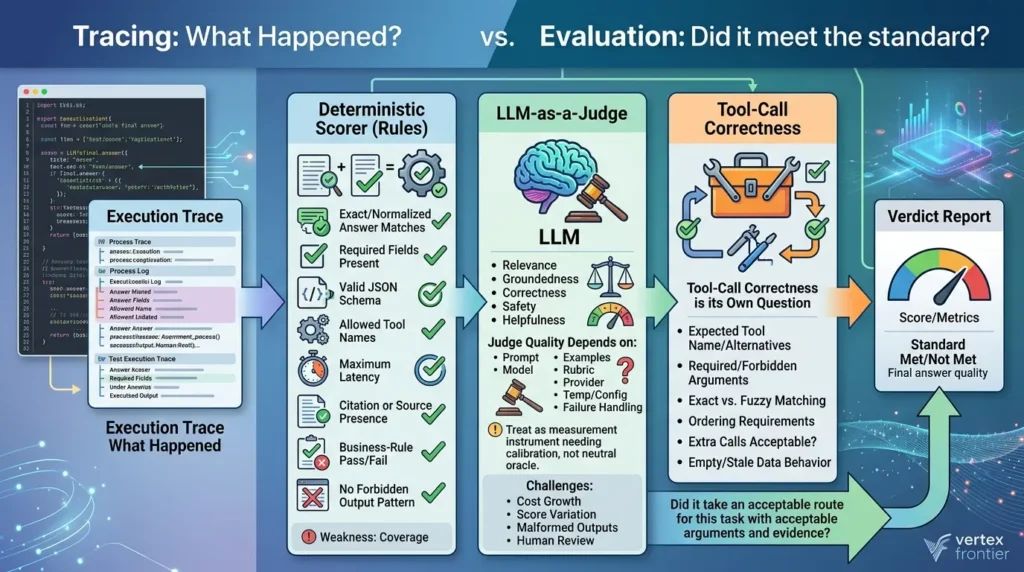
Tracing answers “what happened.” Evaluation answers “did it meet the standard?”
Deterministic scoring
Use deterministic scorers for rules that can be expressed explicitly:
- exact or normalized answer matches;
- required fields present;
- valid JSON schema;
- allowed tool names;
- maximum latency;
- citation or source presence;
- business-rule pass/fail;
- no forbidden output pattern.
These checks are fast and repeatable. Their weakness is coverage: a rule can verify that a citation exists without proving that the citation supports the claim.
LLM-as-a-Judge
An LLM judge can assess criteria such as relevance, groundedness, correctness, safety, or helpfulness. MLflow documents built-in and custom judge patterns, but a judge should be treated as a measurement instrument that needs calibration, not as a neutral oracle.
Judge quality depends on the prompt, model, examples, rubric, provider, temperature/configuration, and failure handling. Community discussions also report cost growth, score variation, malformed outputs from smaller judge models, and the continuing need for human review. Those are practitioner signals, not universal benchmarks.
Tool-call correctness is its own question
A final answer can sound excellent even when the agent chose the wrong tool. MLflow’s ToolCallCorrectness scorer is designed for tool selection and arguments, with details and availability that should be checked against the installed release.
A serious tool-call test should specify:
- expected tool name or acceptable alternatives;
- required and forbidden arguments;
- exact versus fuzzy argument matching;
- ordering requirements;
- whether extra calls are acceptable;
- expected behavior when the tool returns empty or stale data.
Do not reduce the question to “did it call a tool?” The useful question is “did it take an acceptable route for this task, with acceptable arguments and evidence?”
A complete evaluation loop with mlflow.genai.evaluate()
The current MLflow agent-evaluation guidance supports evaluation from inputs and outputs, prediction functions, and traces, depending on the release and configuration. A later implementation should pin the MLflow version and execute the example rather than presenting untested pseudocode as universal production syntax.
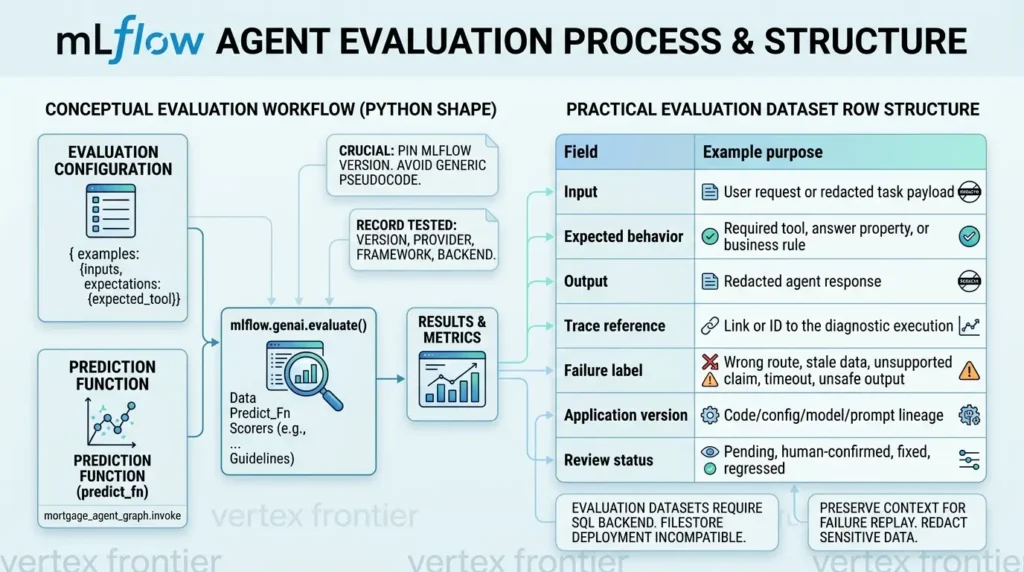
The conceptual shape is:
Python — evaluation workflow shape; verify names against your pinned MLflow release:
import mlflow
from mlflow.genai.scorers import Guidelines
examples = [
{
"inputs": {"question": "What is the current pipeline status?"},
"expectations": {
"expected_tool": "ceo_pipeline_summary"
}
}
]
def predict_fn(question):
return mortgage_agent_graph.invoke({"question": question})
result = mlflow.genai.evaluate(
data=examples,
predict_fn=predict_fn,
scorers=[
Guidelines(
name="grounded_answer",
guidelines="The answer must use the returned pipeline data and state uncertainty when data is missing."
)
]
)
The exact scorer imports, dataset schema, trace-based arguments, and tool-call options are release-sensitive. The implementation should record the tested MLflow version, model provider, framework version, and backend. The evaluation datasets documentation also states that evaluation datasets require a SQL backend; do not assume a FileStore deployment supports the same workflow.
A practical evaluation dataset row should preserve enough context to replay the failure without retaining unnecessary sensitive data:
| Field | Example purpose |
|---|---|
| Input | User request or redacted task payload |
| Expected behavior | Required tool, answer property, or business rule |
| Output | Redacted agent response |
| Trace reference | Link or ID to the diagnostic execution |
| Failure label | Wrong route, stale data, unsupported claim, timeout, unsafe output |
| Application version | Code/config/model/prompt lineage |
| Review status | Pending, human-confirmed, fixed, regressed |
Online evaluation and production sampling
Offline evaluation runs a known dataset. Online evaluation examines selected production traces or sessions. Human review investigates the cases that automated checks cannot settle.
These modes should not be mixed casually:
- Offline: repeatable regression and release comparison.
- Online: sampled evidence from real workflows, often with filters and asynchronous judges.
- Human review: calibration, escalations, policy-sensitive cases, and ambiguous failures.
Current MLflow documentation describes production evaluation controls such as scope, filters, sampling, and asynchronous execution. These features are release-sensitive, so the article or implementation should document the exact version and configuration.
Sampling is not a promise that every error will be exported. It is normally applied at the trace/root level, and child spans are available when the parent trace is retained. If error visibility matters, measure trace coverage and loss explicitly rather than writing “we always keep 100% of errors” without a documented mechanism.
The minimum metric contract for a multi-agent system
A dashboard becomes useful when every metric has a decision attached to it. The following is a practical starting contract; its thresholds are examples to tune for the workload, not industry standards.
| Boundary | Record | Status | Evidence to attach |
|---|---|---|---|
| MLflow package | Exact version and installation method | Not tested / Tested | Lockfile, command output, test date |
| Framework integration | LangChain, LangGraph, custom, or OTel-native path | Not tested / Conditional / Tested | Minimal reproduction and trace screenshot/export |
| Execution model | Sync, async, queue, or background job | Context preserved / Gap found | Trace-parent assertion across the boundary |
| Evaluation backend | SQL-backed deployment and dataset configuration | Supported / Not supported | Backend configuration and evaluation run |
| Model provider | Provider, model identifier, response metadata | Token data available / Unavailable | Redacted response and cost-calculation method |
| Data controls | Redaction, retention, access, external judges | Reviewed / Exception open | Data-flow review and policy decision |
The contrarian point is that missing evidence is itself a production metric. If 30% of requests have no reliable tool span because an async boundary lost context, a dashboard showing only the 70% that were captured can create false confidence.
Privacy, retention, and access control are part of observability
A detailed trace may contain prompts, customer records, retrieved documents, tool arguments, credentials accidentally included in a payload, or sensitive business decisions. More visibility is not automatically better visibility.
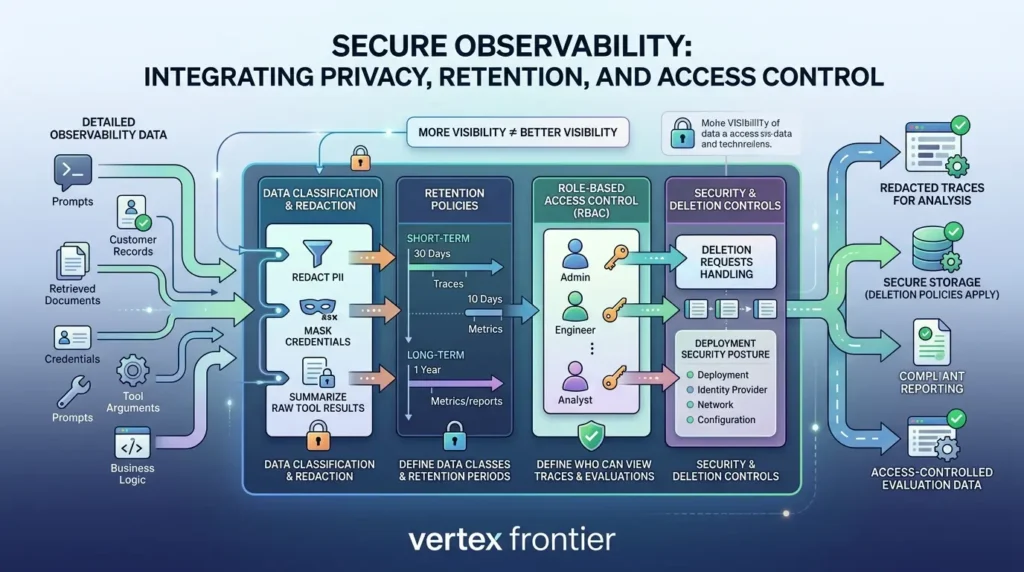
Before enabling broad capture, define:
- which inputs and outputs are retained;
- which fields are redacted before export;
- whether raw tool results are stored or summarized;
- who can view traces and evaluation data;
- how long different data classes are retained;
- whether an external judge receives production content;
- how deletion and access requests affect trace storage;
- which attributes are forbidden as high-cardinality dimensions.
Current MLflow self-hosting documentation discusses authentication and deployment controls, so a current article should not repeat older claims that MLflow has no authentication story. The exact security posture still depends on deployment, identity provider, network, storage, and configuration. “MLflow is secure by default” would be just as overbroad as “MLflow has no security controls.”
For security context, Vertex Frontier’s guides on MCP permissions and OAuth hardening and non-human identities in agentic AI provide useful adjacent reading. Observability cannot compensate for a tool that has excessive permissions.
Failure-mode matrix: connect symptoms to evidence and action
A dashboard becomes operational when an engineer can move from a symptom to the next diagnostic step. The matrix below is a reusable starting point. It intentionally avoids universal alert thresholds because the right baseline depends on the workload.
| Symptom | Likely evidence boundary | Inspect first | Regression candidate |
|---|---|---|---|
| Correct HTTP status, wrong answer | Quality or data lineage | Tool payload, source timestamp, expected business rule | Redacted input, expected evidence, accepted answer properties |
| Tool span missing | Instrumentation or context propagation | Parent trace, async boundary, exporter status | Cross-service parent/child assertion |
| Latency spike without API error | Nested model, retrieval, queue, or judge span | p50/p95 by span type and retry count | Bounded route with latency budget |
| Judge scores drift | Rubric, judge version, or task distribution | Human calibration set and judge configuration | Fixed calibration examples with review labels |
| Cost rises without traffic growth | Retries, loops, prompt size, judge sampling | Tokens per successful task and calls per trace | Maximum-step and cost-budget test |
| Sensitive value appears in trace | Redaction or payload policy | Raw inputs, tool results, exporter, judge recipient | Synthetic secret and redaction assertion |
OpenTelemetry: transport is not the same as a finished observability product
MLflow supports OpenTelemetry-related workflows, including OTLP export. OpenTelemetry can help standardize transport and context propagation across services, but exporting spans does not automatically create the right dashboards, alerts, retention policy, or semantic interpretation in every backend.
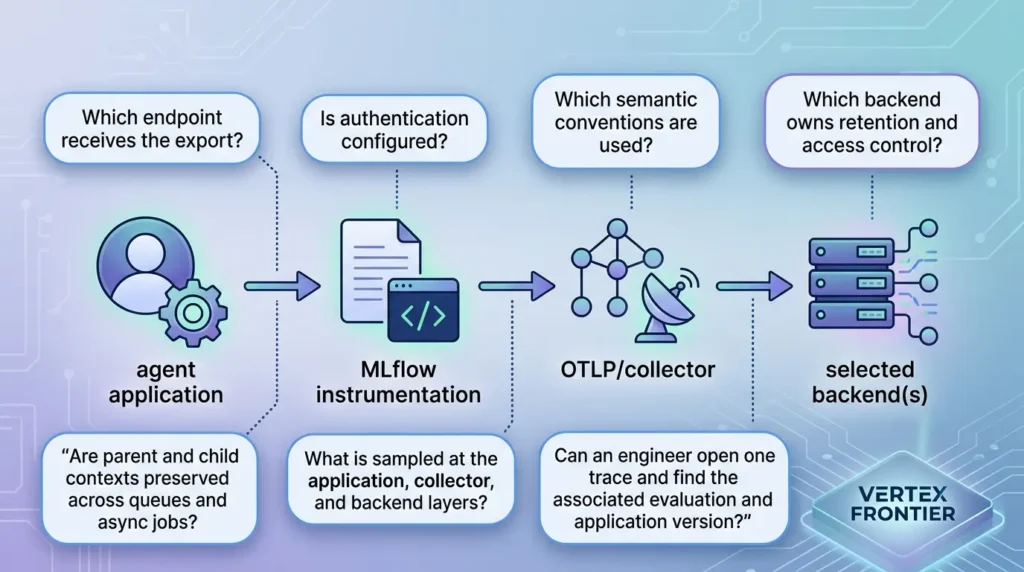
A typical boundary is:
agent application → MLflow instrumentation → OTLP/collector → selected backend(s)The production questions are practical:
- Which endpoint receives the export?
- Is authentication configured?
- Which semantic conventions are used?
- Are parent and child contexts preserved across queues and async jobs?
- What is sampled at the application, collector, and backend layers?
- Which backend owns retention and access control?
- Can an engineer open one trace and find the associated evaluation and application version?
The MLflow OTLP export documentation and the OpenTelemetry overview of LLM observability should be checked against the exact deployment rather than summarized as “OpenTelemetry solves observability.” It solves important interoperability problems; it does not decide what quality means for your business.
Version lineage: prompts are not the whole application
Prompt versions matter, but prompt lineage alone cannot reproduce an agent incident. The observed behavior may depend on:
- application code;
- framework and MLflow versions;
- model/provider version;
- tool schemas and remote service versions;
- retrieval index and source data;
- system configuration;
- prompt version;
- evaluation dataset and judge version;
- deployment environment.
MLflow’s application and version-tracking documentation addresses a broader lineage model. The Prompt Registry provides immutable prompt versions and aliases, but an alias only changes behavior without redeployment if the application resolves that alias dynamically.
The practical rule is simple: record the version that actually ran, not merely the version you intended to run.
Before and after: what maturity looks like
Before observability is operationalized
- The dashboard reports status code, total latency, and exceptions.
- The team sees the final answer but not the tool payload.
- A wrong answer becomes a prompt-tuning debate.
- Offline tests live in a notebook and are not connected to incidents.
- The prompt has a version, but the code, index, tool schema, and judge do not.
- Trace data is either absent or retained without a clear privacy policy.
After the operating loop is in place
- A request opens a trace with the route, handoffs, tools, and safe evidence references.
- A missing or empty tool result becomes a measurable failure mode.
- A business-rule check can fail even when HTTP status is 200.
- A reviewed production failure becomes a regression example.
- The release is associated with code, prompt, model, data, and evaluation versions.
- The team knows which evidence was sampled, redacted, retained, or lost.
The difference is not the number of charts. It is whether the system can learn from a failure.
MLflow versus adjacent observability choices
No single tool is automatically the right answer. MLflow is especially attractive when tracing, evaluation, model/application lineage, and MLOps workflows need to live together. Other tools may be a better fit depending on the existing stack and the desired center of gravity.
| Option | Strong fit | Questions to verify before choosing |
|---|---|---|
| MLflow | Evaluation, tracing, prompt/application lineage, ML platform workflows | Exact integrations, deployment model, version behavior, security configuration |
| Langfuse | LLM application tracing and product-oriented observability | Evaluation depth, retention, hosting, integration boundaries |
| LangSmith | LangChain/LangGraph-centered development and debugging | Framework coupling, data residency, team workflow |
| Arize Phoenix | Open-source-oriented tracing and evaluation workflows | Backend, deployment, instrumented coverage, operational ownership |
| Datadog LLM Observability | Teams already operating on Datadog | Cost model, data handling, agent-specific depth, vendor integration |
| OpenTelemetry plus a backend | Existing standardized telemetry platform | Semantic conventions, dashboards, judge/evaluation layer, storage and ownership |
This is a decision aid, not a benchmark. Vendor capability pages and public comparisons are useful for forming a shortlist, but a controlled test on your own workflow is more reliable than a feature checklist.
Estimating LLM-judge cost without fooling yourself
A planning estimate can help decide whether to judge every trace, sample production traffic, or use deterministic checks first. But examples × judges is not automatically the number of model requests. Predict functions, retries, batching, deterministic scorers, and judge implementation can change the total.
Use this calculator as a planning aid, not a billing statement:
LLM judge planning calculator
Planning estimate: 1,500 judge calls × $0.0030 = $4.50. Actual usage can differ because of predict_fn calls, retries, batching, deterministic scorers, and provider billing.
The safer cost-control sequence is:
- Run deterministic checks first.
- Judge only the examples that need semantic review.
- Sample production traces instead of sending every trace to a judge.
- Batch or cache where the implementation supports it.
- Track judge cost per successful task, not only cost per request.
- Calibrate a smaller human-reviewed set before trusting score movement.
Common mistakes when moving from notebook to production
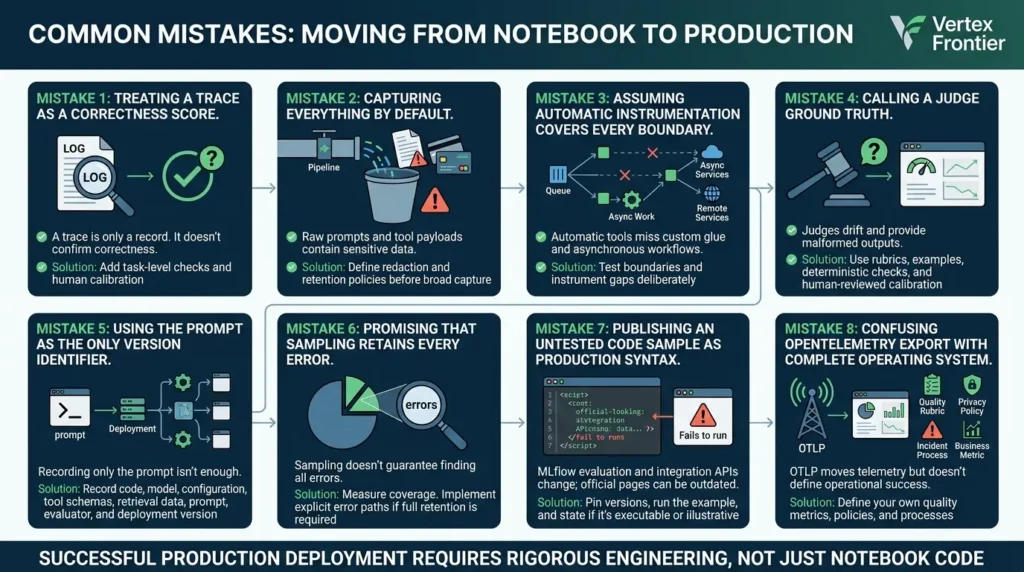
Mistake 1: Treating a trace as a correctness score
A trace is a record. Add task-level checks and human calibration.
Mistake 2: Capturing everything by default
Raw prompts and tool payloads can contain sensitive data. Define redaction and retention before broad capture.
Mistake 3: Assuming automatic instrumentation covers every boundary
Test custom glue, asynchronous work, queues, MCP servers, and remote services. Instrument missing boundaries deliberately.
Mistake 4: Calling a judge ground truth
Use a rubric, examples, deterministic checks, and human-reviewed calibration cases. Monitor judge drift and malformed outputs.
Mistake 5: Using the prompt as the only version identifier
Record code, model, configuration, tool schemas, retrieval data, prompt, evaluator, and deployment version.
Mistake 6: Promising that sampling retains every error
Measure coverage. If a requirement truly needs full error retention, implement and verify an explicit error path.
Mistake 7: Publishing an untested code sample as production syntax
Pin the versions, run the example, and state whether it is executable or illustrative. MLflow’s evaluation and integration APIs change, and even official pages can describe behavior differently across releases.
Mistake 8: Confusing OpenTelemetry export with a complete operating system
OTLP can move telemetry. It does not define your quality rubric, privacy policy, incident process, or business success metric.
The one-page evidence capture card
When a user reports a wrong answer, do not begin with “which prompt should we change?” Capture the evidence first. The following card can be copied into an incident ticket or internal review document.
A useful incident record should reference redacted trace data rather than copy a customer’s full prompt or tool payload into a ticket. The purpose is to preserve the causal chain, not to create another uncontrolled data store.
Reusable incident-review template
When a confirmed failure occurs, capture it in a structured record before changing the prompt. This keeps the investigation focused on evidence and makes the eventual regression test reproducible.
Incident ID: ____________________ Date: ____________________
User-visible symptom: ________________________________________________
Trace/session reference: ______________________________________________
Application, model, prompt, and tool versions: ____________________________
Observed route: supervisor → __________________ → __________________
Expected behavior and evidence: ________________________________________
Failure class: wrong route / bad arguments / stale data / missing context / judge issue / privacy issue / other
Immediate containment: ________________________________________________
Regression-test decision: add / do not add — reason: _______________________
The record should contain redacted references rather than copying sensitive customer data into a public ticket or a long-lived dataset. The goal is to preserve the failure’s diagnostic shape while minimizing unnecessary exposure.
A practical launch checklist
Before calling a multi-agent observability implementation production-ready, verify:
Launch & Operational Checklist
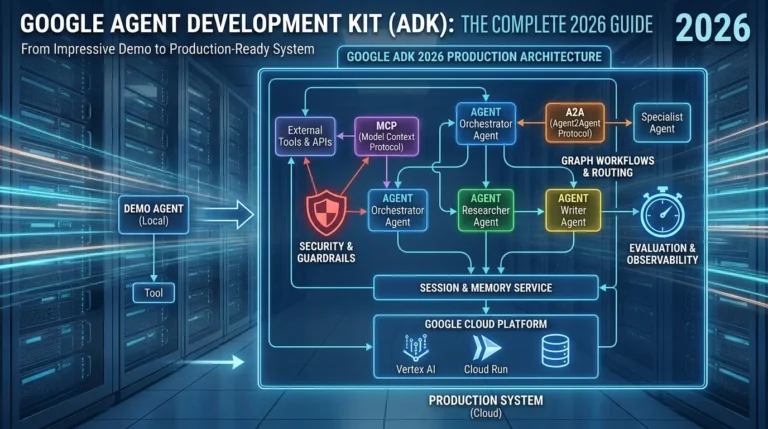
Select completed items to track readiness progressFor system-level context, related Vertex Frontier articles on the Google Agent Development Kit, Harness Engineering for reliable AI agents, and LlamaIndex versus LangChain in production RAG connect observability to agent architecture, testing, and framework choice. The enterprise RAG security guide is relevant when retrieval results enter traces or evaluation datasets.
Final takeaway
The point of MLflow observability is not to make a multi-agent system look measurable. It is to make failures explainable and preventable.
A mature implementation connects five things: the route an agent took, the evidence it used, the quality of its answer, the version that produced it, and the control that prevents the same failure from returning. That is why a production-ready design needs more than autolog( ), more than a latency chart, and more than a judge score.
Start with one real workflow. Trace the supervisor, workers, tools, and data boundaries. Define what “correct” means before choosing a judge. Redact before retention. Turn the first confirmed failure into a regression example. Then expand the system one evidence boundary at a time.
Skip building from scratch. Get immediate access to the full incident-review template, metrics matrix, evaluation dataset, and cost worksheets in ready-to-use formats.
Download Free Production Kit (ZIP)Instant download • No email or registration needed
FAQs: Multi-agent observability with MLflow
What is multi-agent observability?
It is the ability to inspect and evaluate the route a request takes through multiple agents, tools, models, retrieval systems, and services—not only the final HTTP response.
Is MLflow tracing enough to prove that an agent answer is correct?
No. Tracing provides execution evidence. Correctness requires deterministic checks, domain rules, LLM judges, human review, or a combination appropriate to the task.
Does MLflow automatically capture every database result and token count?
No universal guarantee should be made. Token usage depends on the model provider and integration. Database payloads generally require deliberate instrumentation, and retaining them may create privacy risk.
What is the difference between offline and online evaluation?
Offline evaluation runs a known dataset for regression and release comparison. Online evaluation scores selected production traces or sessions, usually with sampling, filters, asynchronous judges, and stricter privacy controls.
How should I evaluate tool calls?
Check the expected tool, arguments, ordering, extra calls, and behavior when the tool returns empty or stale data. MLflow’s ToolCallCorrectness scorer can help where supported, but verify its availability and behavior in your installed release.
Can OpenTelemetry replace MLflow?
OpenTelemetry can provide a useful interoperability and transport layer. It does not automatically supply MLflow’s evaluation workflow, prompt/application lineage, business-quality rubric, or incident-to-regression process.
Should every production trace be sent to an LLM judge?
Usually not without a cost, privacy, and latency plan. Start with deterministic checks and a calibrated sample, then expand coverage when the value justifies the additional judge calls and data exposure.

Was this article helpful?


[…] one layer up: when the wrong answer comes from a multi-agent system rather than a retriever, multi-agent observability with MLflow extends that lineage to supervisor and worker spans, tool calls, and prompt versions, so debugging […]
[…] multi-agent systems in production, this kind of per-step scoring is exactly what multi-agent observability with MLflow automates, turning ad-hoc skill evaluation into continuous, traceable evidence across every […]
[…] or overridden becomes a system-level incident, not a wrong answer, which is exactly the gap that multi-agent observability with MLflow is designed to close by tracing the decision path before the lost instruction reaches […]