
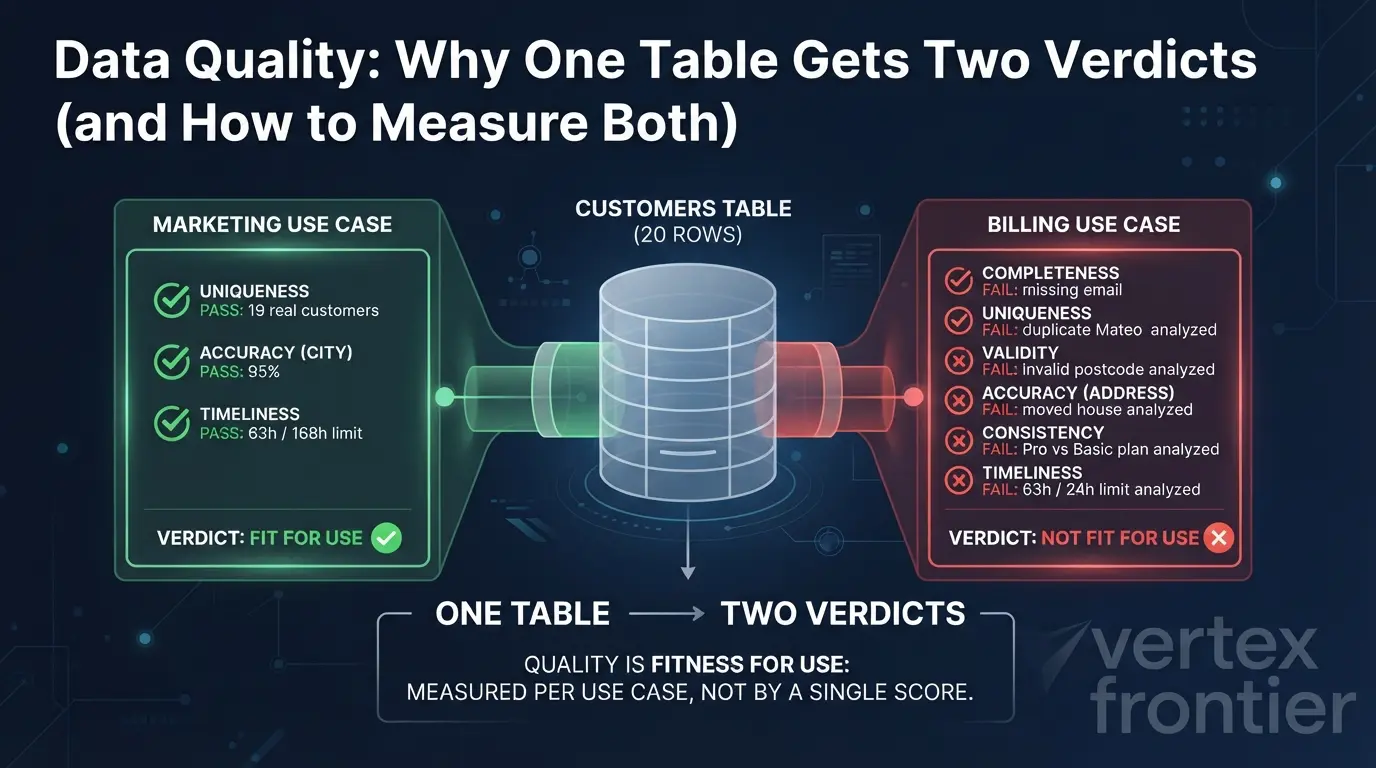

It is 9 a.m. on Monday, and a customers table with twenty rows is about to be used by two teams.
Marketing wants a head count by city to plan next month’s campaign. The table says 20 customers. The truth is 19, and one of them has moved house. Marketing shrugs. A campaign plan survives a 5% wobble.
Billing wants to send this month’s invoices from the same rows. One customer has no email address. One is listed twice. One postcode cannot exist. One address belongs to a flat the customer left in August. One plan disagrees with the billing system. And the last load landed on Friday evening. Five of 19 customers would get a wrong invoice or none at all. Billing calls the table broken.
Same rows, same morning, opposite verdicts. Both teams are right.
That is the core idea behind data quality, and it is why “is our data any good?” has no one-number answer. Quality is a set of measurements, each with a threshold, and each threshold belongs to a use case. The cost of ignoring this is not abstract, though the numbers deserve care. Gartner’s much-quoted figure is an average cost of poor data quality of $12.9 million a year per organization, and the footnote on a reprint of its report page ties it to a 2020 survey of reference customers for its Magic Quadrant for Data Quality Solutions. Read it as an indicative estimate, not a measurement.
AI makes the problem sharper. A dashboard with a bad number waits for a human to squint at it. An autonomous system acts on the number. Once agents start calling this data on their own, a quality defect compounds instead of sitting still, which is a theme we explore in our guide to the 20 concepts that separate senior agent engineers from demo builders.
In this guide you will get:
- a plain definition of data quality, and the 1996 paper behind it
- the six dimensions, each pinned to a real defect and a real company failure
- a five-part rule format (dimension, rule, denominator, threshold, owner) you can copy
- working calculators and a verdict simulator you can use on your own numbers
- how dbt, Great Expectations, Soda and observability tools fit together, with code
- where data quality ends and data governance begins
Key Takeaways
Click any topic to expand or collapseWhat is data quality?
Data quality is how well a dataset fits the job it is being used for. The classic definition, from Wang and Strong’s 1996 paper, calls it data that is fit for use by data consumers. You measure it one dimension at a time, against thresholds each use case sets for itself.
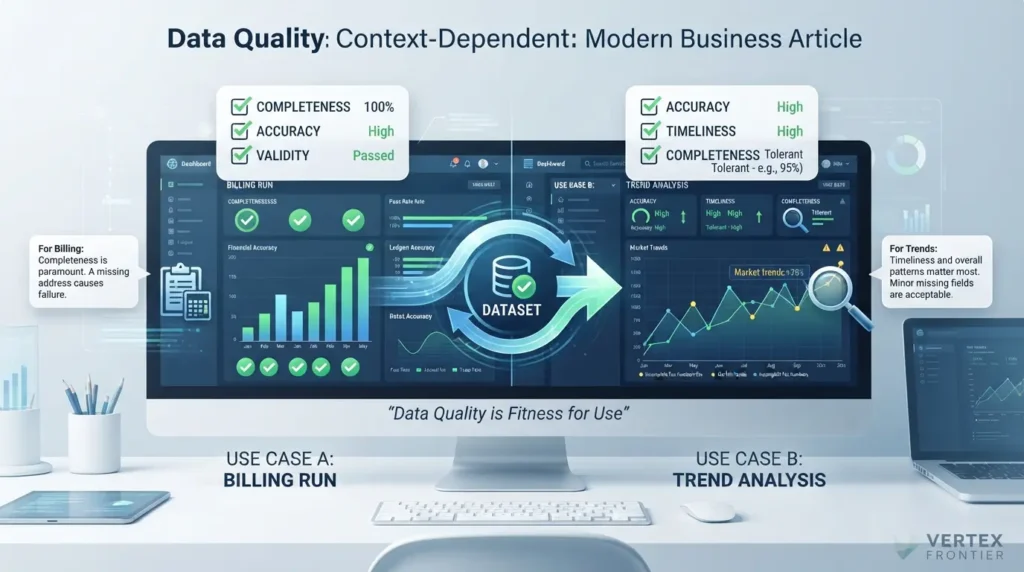
That definition comes from Wang and Strong’s paper “Beyond Accuracy: What Data Quality Means to Data Consumers”, published in the Journal of Management Information Systems (12(4), 5-33). The authors point out that “fitness for use” was already widely adopted in the quality literature, and they take the consumer’s viewpoint because the consumer is the one who judges whether data is fit. The title is a hint: accuracy is only one of the things data consumers care about.
Public-sector guidance says the same thing in practice. The UK Government Data Quality Framework guidance describes dimensions as a guide for writing rules, and says their priority should be dictated by user needs. It makes the point with a deliberately mundane example: very few business processes fail because a fax number field is incomplete, so assessing quality for different uses gives different results. Notice what that rules out: a universal ranking of dimensions. For a billing run, completeness may be everything. For a trend chart, it may barely matter.
Quality is a relationship between data and a job. Change the job and the verdict can change, even though not one byte of data moved.
One table, two verdicts: the 20-row test
Here is the table from the opening, in full. It is loaded by a nightly job from the CRM. It holds 20 rows, which represent 19 real customers. The last successful load ran at 6 p.m. on Friday, and the weekend runs failed without anyone noticing. The check runs at 9 a.m. on Monday.
Six rows carry defects. Each one breaks a different rule.
| Row | What is wrong | Dimension broken | Hurts marketing? | Hurts billing? |
|---|---|---|---|---|
| Noor | Email is blank | Completeness | Barely | Yes: no invoice can be sent |
| Mateo | Appears twice, under two customer IDs, same email | Uniqueness | Slightly (count is 20, not 19) | Yes: invoiced twice |
| Hana | Postcode “M4 1X” cannot exist | Validity | No | Yes: invoice may be misrouted |
| Jonas | Still listed in Bristol; he moved to Leeds in August. The postcode is well formed. | Accuracy | Slightly (wrong city) | Yes: invoice goes to an old address |
| Ines | CRM says Pro plan; the billing system says Basic | Consistency | No | Yes: billed on the wrong plan |
| Whole table | Last load Friday 6 p.m.; checked Monday 9 a.m. (63 hours old) | Timeliness | No (a week is fine) | Yes: weekend changes are missing |
Now do the arithmetic from each team’s point of view.
Marketing needs uniqueness, a correct city, and data no older than a week. The table scores 95% on uniqueness (19 real customers in 20 rows), 95% on city accuracy, and is 63 hours old against a limit of 168. Every threshold passes.
Billing needs every row-level rule at 100% and data no older than 24 hours. Five of the 19 real customers would receive a wrong invoice or none, so only 14 of 19 invoices (about 74%) would be right. All six dimensions fail.

One table. Two verdicts. And if you had averaged the numbers into a single score, you would have reported a calm 95% to both teams. We will come back to why that is the most dangerous number on the dashboard.
A table has no quality score of its own. It has one verdict per use case, and each verdict needs its own thresholds.
The six dimensions of data quality
A dimension is a heading, not a measurement. It names a kind of defect so you can write a rule for it. The most widely used set comes from DAMA UK’s paper “The Six Primary Dimensions for Data Quality Assessment”, written by a DAMA UK working group in October 2013. The UK Government Data Quality Hub recommends the same six.
The six dimensions of data quality are:
- Completeness: is the data you expected actually there?
- Uniqueness: is each real-world thing recorded only once?
- Validity: does each value follow its required format, type and range?
- Accuracy: does the data describe the real world correctly?
- Consistency: do different copies of the same fact agree?
- Timeliness: is the data fresh enough for the moment it is used?
| Dimension | Question it asks | Defect in our table | How it is measured | Typical check |
|---|---|---|---|---|
| Completeness | Is anything missing? | Noor has no email | % of required values present | dbt not_null; Soda missing_count |
| Uniqueness | Is anything recorded twice? | Mateo has two IDs | Real-world things / records | dbt unique on the business key |
| Validity | Is it well formed? | Hana’s postcode | % of values matching format, type, range | GX regex match; Soda invalid_count |
| Accuracy | Is it true? | Jonas still in Bristol | % of sampled rows confirmed against a reference | Scheduled sample audit (no in-table test) |
| Consistency | Do copies agree? | Ines: Pro vs Basic | % of rows that match across systems | A join query that returns disagreeing rows |
| Timeliness | Is it fresh enough? | Friday load, Monday check | Age in hours versus an agreed limit | dbt freshness; Soda freshness |
Completeness: is everything there that should be?
DAMA UK defines completeness as the share of stored data against the potential of 100% complete. The word that does the work is “potential”. A business rule decides what complete means. If email is optional, Noor’s blank is not a defect at all.
There is a second, quieter meaning. Completeness also covers whole records that never arrived. A column with no nulls can still be missing a thousand rows. The Public Health England case later in this guide shows what that costs.
Uniqueness: is each real thing recorded once?
The rule is simple: no real-world thing is recorded more than once, judged by how that thing is identified. The catch is in the last clause.
Every customer_id in our table is unique, so a uniqueness test on that column passes. Mateo signed up a second time and was handed a new ID. The duplicate only appears when you test the column that actually identifies a customer, which here is the email. Choosing that column is a business decision, not a technical one.
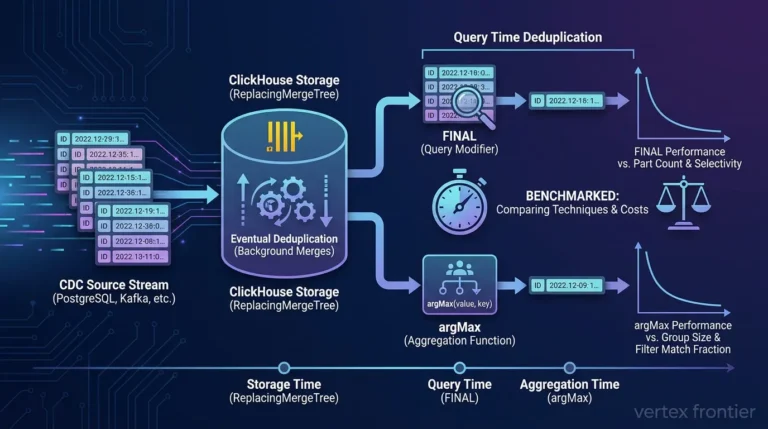
DAMA UK gives a formula for it: real-world things divided by records. When the duplicates arrive through change data capture rather than a re-signup, the fix depends on your database engine. Our teardown of ReplacingMergeTree vs FINAL vs ArgMax in ClickHouse covers that case.

Validity: is the value well formed?
A value is valid when it follows the syntax of its definition: format, type and range. Syntax is all validity knows.
A UK postcode ends with an inward code of exactly three characters: a digit, then two letters. “M4 1X” ends in “1X”, which has two. The rule rejects it without knowing where Hana actually lives. The reverse also holds. A well-formed postcode can still describe a street that does not exist, and validity will wave it through.
Accuracy: does the data match the world?
Accuracy is the degree to which data correctly describes the real-world thing it stands for. Jonas’s row is complete, unique, well formed and consistent with billing. It is also wrong.
Nothing inside the table can reveal that. Accuracy needs an outside reference: an authoritative dataset, or the customer confirming their details. That is why accuracy is usually a scheduled sample audit rather than a test on every load.
Consistency: do two copies agree?
Consistency is the absence of difference when you compare two or more representations of the same thing. The CRM says Ines is on Pro. Billing says Basic.
A consistency check tells you the two disagree. It cannot tell you which one is right. Only a governance decision can: if billing is the system of record for plans, the CRM is the one that is wrong.
Timeliness: is it fresh enough for this moment?
Timeliness is how well data represents reality at the point in time you need it. It is the only one of the six that is measured in time instead of a percentage.
The table was 63 hours old at the Monday check. Whether that is acceptable depends on who asks. Some delay is unavoidable, so the useful question is never “is it fresh?” but “is it fresher than the agreement says?”
Six dimensions, six different kinds of defect. Five of them can be tested on the table itself. Accuracy cannot.
Why six? Where the standards disagree about the edge of quality
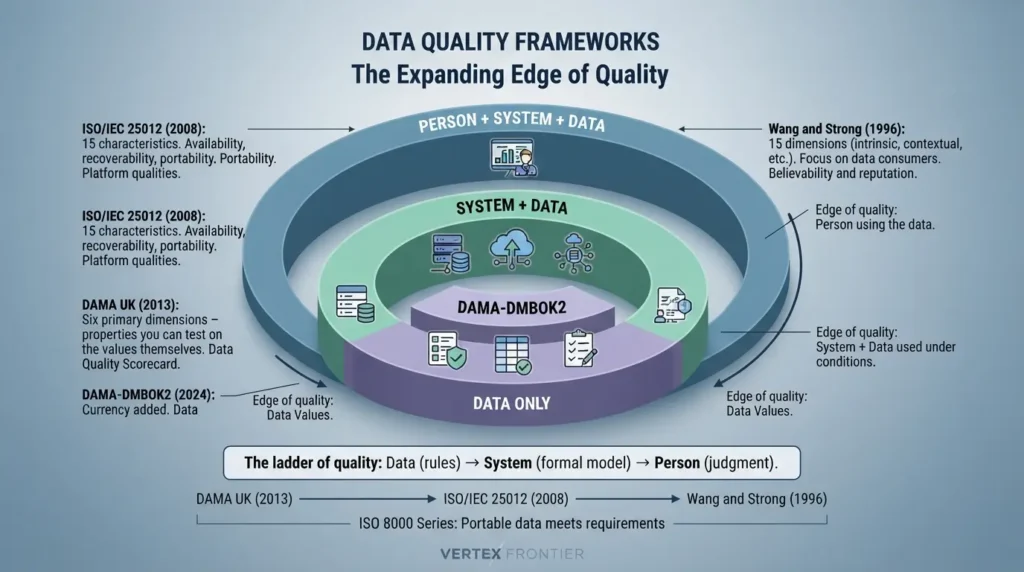
Six is a convention, not a law. Even among data quality professionals, the key dimensions are not universally agreed. Different standards give you different lists, and the lists look contradictory until you notice what each one is really deciding: where the edge of quality sits.
- DAMA UK stays inside the data. Its six dimensions describe properties you can test on the values themselves.
- ISO/IEC 25012 adds the system around the data. Some qualities, such as availability and recoverability, belong to the platform that holds the data, not the data itself.
- Wang and Strong add the person reading it. Their list came from asking data consumers what they care about, so it includes judgments like believability.
That is the whole ladder: data, then system, then person.
| Framework | Year | What it lists | Edge of quality | Reach for it when |
|---|---|---|---|---|
| DAMA UK | 2013 | Six primary dimensions | The data only | You need rules and a scorecard this quarter |
| DAMA-DMBOK2 | 2017 (revised 2024) | A longer list than DAMA UK; the 2024 revision added currency | The data, inside a management program | You are designing a program, not just checks |
| ISO/IEC 25012 | 2008 | 15 characteristics: 5 inherent, 3 system-dependent, 7 both | Data plus the system that holds it | You need a formal model for audits or procurement |
| ISO 8000 | Series | Quality as “portable data that meets stated requirements” | The requirements, wherever they come from | Master data moves between organizations or suppliers |
| Wang and Strong | 1996 | 179 attributes collected; 15 dimensions in 4 categories after rating and sorting | The person using the data | You want to understand why users distrust a dataset |
A few details worth knowing before you cite any of these:
- DMBOK2 is DAMA International’s body of knowledge. Its 2024 revision is a maintenance release that kept the framework intact and added currency as a recognized data quality dimension.
- ISO/IEC 25012 defines 15 characteristics from two points of view, inherent and system-dependent. Five are inherent to the data (accuracy, completeness, consistency, credibility, currentness), three depend on the system (availability, portability, recoverability), and seven belong to both. The model frames both views around data used under specified conditions.
- ISO 8000 is described by ECCMA, the organization that leads the project, as the international standard for exchanging quality data. It defines quality data as portable data that meets stated requirements, and it is concerned mainly with master data such as product and supplier records.
- Wang and Strong surveyed data consumers instead of deciding the dimensions in advance. A first survey produced 179 attributes, a second survey rated 118 of them, factor analysis produced 20 dimensions, and a sorting study kept 15, grouped into four categories: intrinsic, contextual, representational and accessibility.
Two of these ideas deserve translating into practice.
First, the frameworks already contain the one-table, two-verdicts idea. Wang and Strong file completeness and timeliness under contextual data quality, which they describe as quality that must be judged within the context of the task at hand. ISO/IEC 25012 likewise ties its definitions to data used under specified conditions. Operationally, thresholds belong to use cases, not to tables.
Second, Wang and Strong place believability and reputation inside intrinsic quality, next to accuracy. Those two are hard to express as a single SQL query (an editorial judgment, not a finding of the paper). They tend to be earned through visible ownership, lineage and documentation, which is a governance problem. That is a useful boundary: it tells you which qualities your tooling can realistically measure.
A sorting trick for any unfamiliar list. Take each item and ask whether it describes the data, the system, or the reader. The “data” items map onto the six dimensions, usually by synonym. Those are the ones you can turn into a number.
The frameworks do not disagree about quality. They disagree about how far to extend the word. Start with the six; reach outward only when your problem sits outside the data.
How to measure data quality: rule, denominator, threshold, owner
A dimension only becomes useful when it becomes a number someone is accountable for. The path from one to the other has five steps.
To measure data quality:
- Name the dimension. Which kind of defect are you looking for?
- Write the rule. Express it as a query or check that returns pass or fail per row.
- Choose the denominator. Decide exactly which rows count as “all of them”.
- Set the threshold for one use case. Pick the pass line for this job, not for the table.
- Assign an owner. Name the person who can accept, change or enforce that threshold.
Most teams do the first two steps and skip the last three. That is how dashboards fill up with percentages nobody can act on.
Start where measurement is easiest. A CDC worksheet adapted from the DAMA UK paper notes that completeness and validity are usually the easiest dimensions to assess, followed by timeliness and uniqueness, and that accuracy and consistency are the most difficult. That is a sensible order for a first scorecard.
The formula behind most dimensions
Completeness, validity, consistency and sampled accuracy all share one shape: the share of rows that pass, out of the rows you checked. Uniqueness uses the same ratio with a different top line, as DAMA UK describes it: real-world things over records.
Try 19 of 20 against 90, then against 100.
Apply it to the customers table and you get the scorecard below. The denominator is the quiet decision in each row. If the table also held closed accounts, the completeness rule should count only active customers, because nobody invoices a closed account.
| Dimension | Rule | Denominator | Result |
|---|---|---|---|
| Completeness | Email is not null | All active customer rows | 19 / 20 = 95% |
| Uniqueness | One row per email address | All rows (real customers / records) | 19 / 20 = 95% |
| Validity | Postcode matches the UK format | All rows | 19 / 20 = 95% |
| Accuracy | Address confirmed against a reference | Audited rows (a random sample on big tables) | 19 / 20 = 95% |
| Consistency | CRM plan equals billing plan | Rows that exist in both systems | 19 / 20 = 95% |
| Timeliness | Time since last successful load | Measured in hours, not rows | 63 hours |
Timeliness breaks the percentage pattern, so it gets its own formula and its own calculator.
Prefilled with the Friday 6 p.m. load and the Monday 9 a.m. check.
Sampling, because accuracy is expensive
Every accuracy check costs something: a lookup against a reference, or a phone call to a customer. On a table of 2 million rows you cannot check them all, so you check a random sample on a schedule. Sampling is standard practice rather than a hard rule.
A quick sense of the trade-off: with a random sample of 400 rows, the margin of error on a pass rate is at most about plus or minus 5 percentage points at 95% confidence (1.96 x the square root of 0.25 / 400). Bigger samples tighten that range. What matters is that the sample is random, and that someone is assigned to run it.
Advanced insight: the denominator is policy. "95% complete" means nothing until someone has decided which rows count. Counting closed accounts in a billing completeness rule lowers the score for a reason nobody can fix. Excluding too much raises it for a reason nobody should trust. Write the denominator down next to the rule.
Thresholds belong to the use case
Once the rules exist, each use case sets its own pass lines on the rules it depends on. Marketing depends on uniqueness, city accuracy and timeliness. Billing depends on all six. Somebody owns each set, usually whoever owns the use case: the head of marketing for the campaign, the Head of Billing for invoices.
A threshold is not always 100%. The UK Government guidance says checks should describe what typical good quality looks like, not rules every value must meet. Its example is an animal date-of-birth field, where one implausible outlier does not make the data set unfit, and it suggests a 98% target for that check. Billing's 100% is a choice about money, made by the person accountable for it. It is not a universal law.
Try it yourself. The simulator below holds the measured values from our table fixed and lets you change the thresholds. Start with the marketing preset, then switch to billing.
Measured: five row-level rules at 95%, data age 63 hours. Leave a threshold blank if the use case does not depend on that dimension.
| Dimension | Measured | Required | Result |
|---|---|---|---|
| Completeness | 95% | min % | |
| Uniqueness | 95% | min % | |
| Validity | 95% | min % | |
| Accuracy | 95% | min % | |
| Consistency | 95% | min % | |
| Timeliness | 63 hours | max hours |
Great Expectations builds this idea into a single argument called mostly. Set mostly=0.9 on a check and it passes when at least 90% of rows do. That is exactly a threshold, and exactly why you must decide who gets to choose the number. More on that in the tools section.
The contrarian rule: do not put an average on the executive dashboard
Most vendor dashboards roll the dimensions into one headline score. Our table would show 95%. It would look excellent to marketing, and it would look excellent to billing, whose invoices are failing.
Averaging fails for three reasons:
- It treats the dimensions as interchangeable. They are not. A use case usually depends on two or three of them, and the rest are noise.
- It mixes units. Timeliness is measured in hours. You cannot average hours with percentages without inventing an exchange rate.
- It hides the breach. A 95% average can sit on top of a total failure on the one dimension that decides the use case.
So show something else: the worst dimension against its threshold, and the count of threshold breaches. In our billing view that reads "Timeliness: 39 hours over limit; 6 of 6 rules breached; owner: Head of Billing". Nobody has to interpret it.
A fair counterpoint: an average can still work as a long-run trend line, as long as the composition never changes. It is a decent trend and a bad verdict.
- Completeness 95% against 100%: breach
- Uniqueness 95% against 100%: breach
- Validity 95% against 100%: breach
- Accuracy 95% against 100%: breach
- Consistency 95% against 100%: breach
A measurement is a rule, a denominator, a threshold and an owner. Report breaches against thresholds, never a blended score.
Which tools run the checks, and what none of them can see
Rules need somewhere to run. There are two answers, and they do different jobs.
- Inside the pipeline. Tests run on every load and stop it, or raise a flag, when a rule fails. dbt, Great Expectations and Soda all work this way.
- Beside the pipeline. Observability tools learn what normal looks like for each table and alert when the pattern breaks.
None of what follows is a ranking. Each tool below is described from its own documentation, and none of these vendors reviewed or endorsed this guide.

Inside the pipeline: rules you wrote in advance
A dbt data test is a SELECT statement that returns the failing rows. It passes when it returns none. dbt ships two built-in generic tests, not_null for completeness and unique for uniqueness. Everything else is a query you write yourself.
Here is the customers table wired up. Note which column carries the unique test that matters.
YAML Code (dbt schema.yml):
version: 2 models: - name: customers columns: - name: customer_id data_tests: - unique # passes even though Mateo exists twice - not_null - name: email data_tests: - not_null: # completeness, active customers only config: where: "status = 'active'" - unique # uniqueness on the BUSINESS key # Older dbt versions call the key "tests" instead of "data_tests".dbt can also tier its response. Generic tests accept severity, warn_if, error_if and store_failures in their config, as listed on dbt's data test configurations page. That gives you a count-based version of a threshold: warn on the first bad row, fail the run only past a limit, and keep the failing rows for whoever owns the fix.
YAML Code (dbt: tiered test response, illustrative limits):
- name: email data_tests: - not_null: config: where: "status = 'active'" warn_if: ">0" # warn on any missing email error_if: ">20" # fail the run past 20 rows store_failures: true # The limits are examples. Confirm the warn_if / error_if expression # syntax on dbt's severity page before copying them.Validity and consistency need custom queries. These two singular tests live as separate .sql files and each fails when it returns rows.
SQL Code (two dbt singular tests):
-- tests/assert_postcode_format.sql (PostgreSQL syntax; regex functions differ by warehouse) -- Simplified UK format check. It proves the shape, not that the postcode exists. select customer_id, postcode from {{ ref('customers') }} where postcode !~ '^[A-Z]{1,2}[0-9][A-Z0-9]? [0-9][A-Z]{2}$' -- tests/assert_plan_matches_billing.sql -- Consistency: returns every customer whose CRM plan and billing plan disagree. select c.customer_id, c.plan as crm_plan, b.plan as billing_plan from {{ ref('customers') }} c join {{ ref('billing_accounts') }} b on b.customer_id = c.customer_id where c.plan <> b.planThe same validity and completeness rules look different in the other two tools. SodaCL, documented for Soda v3 (including its validity metrics), expresses them as short declarative checks, including invalid_count with a valid format or regex. Newer Soda releases use data contracts with a different syntax, and regular expression support depends on your SQL engine.
YAML Code (SodaCL checks.yml, Soda v3 syntax):
checks for customers: - missing_count(email) = 0 - duplicate_count(email) = 0 - invalid_count(postcode) = 0: valid regex: '^[A-Z]{1,2}[0-9][A-Z0-9]? [0-9][A-Z]{2}$' - freshness(loaded_at) < 24hGreat Expectations uses expect_column_values_to_match_regex for the same validity rule. Its documentation notes that a match can occur anywhere in the string, so an unanchored pattern will happily accept junk around a valid-looking fragment. Anchor with ^ and $.
The mostly argument is a threshold in disguise
Great Expectations ships a mostly argument, which its current documentation describes as fuzzy validation: the expectation succeeds when at least the stated fraction of rows passes (a float between 0 and 1). The same page documents a severity parameter (critical, warning or info), so a threshold breach can raise a warning instead of a failure.
Python Code (Great Expectations, GX Core 1.x style):
import great_expectations as gx postcode_format = gx.expectations.ExpectColumnValuesToMatchRegex( column="postcode", regex=r"^[A-Z]{1,2}[0-9][A-Z0-9]? [0-9][A-Z]{2}$", mostly=0.95, # passes while up to 5% of rows are bad severity="warning", # a breach warns instead of failing as critical ) # The API shape differs between GX versions. Check the docs for yours.mostly=0.95 silently accepts 5% bad data. In our 20-row table that is one bad row. On a 2-million-row table it is 100,000 bad rows, and the check still reports success. Treat mostly as a threshold that needs an owner, not a default to copy from a tutorial.This is where a question practitioners keep asking lands: what is a reasonable mostly value? The honest answer is that it depends on the use case, and the use-case owner sets it. For invoicing the answer is 1.0 on every row-level rule.
For a deeper look at where these checks live in a real pipeline, and how they come up in interviews, see our 50 ETL interview questions, which cover pipeline-level data quality in depth.
Freshness: a low-effort check for silent stalls
Back to Friday. The nightly load stalled after 6 p.m. and nobody wrote a freshness rule. A freshness rule would have caught it before the weekend was over.
dbt's freshness config accepts warn_after and error_after, each with a count and a period in minutes, hours or days. You also tell dbt which column holds the load time.
YAML Code (dbt sources.yml):
version: 2 sources: - name: crm config: loaded_at_field: _loaded_at freshness: warn_after: {count: 12, period: hour} error_after: {count: 24, period: hour} tables: - name: customers # Then run: dbt source freshness (dbt v2.0+: dbt freshness)dbt freshness (v2.0 and later) as the command that checks every source and model with freshness configured, and dbt source freshness as the legacy, sources-only command. Freshness is checked by its own command, so schedule it explicitly instead of assuming a build covers it. In SodaCL (v3), freshness checks use a less-than threshold, and a greater-than form is rejected.| Component | Version boundary | What the examples rely on |
|---|---|---|
| dbt freshness | dbt freshness in v2.0 and later; source freshness nested under config from v1.9; loaded_at_field under config from v1.10 | dbt freshness reference: warn_after and error_after with minute, hour or day periods |
| dbt data tests | data_tests key in current docs; older versions used tests | Data test configurations: where, severity, warn_if, error_if, store_failures |
| Great Expectations | GX Core 1.24.1 documentation | Create an Expectation: gx.expectations classes, mostly, severity |
| SodaCL | Soda v3 documentation; newer Soda data contracts use a different syntax | Validity metrics: invalid_count, valid format or regex; freshness with a less-than threshold |
error_after trips here and the on-call engineer is alerted, two days before the invoice run.Prove the rules work: plant the defects
A rule that has never failed has never been shown to work. Before you trust one, copy a few rows into a scratch table, plant one known defect per rule, and confirm each rule fails on exactly that row. This is a negative test: it checks the check. The approach is an editorial suggestion, and the table below is what you should expect to see.
SQL Code (PostgreSQL, illustrative scratch table):
-- Scratch copy only. Do not run this against production. create table customers_scratch ( customer_id text, name text, email text, postcode text, plan text, status text ); insert into customers_scratch values ('C-1001', 'Ada', 'ada@example.com', 'LS1 4AP', 'Pro', 'active'), ('C-1002', 'Noor', null, 'M1 1AE', 'Basic', 'active'), ('C-1003', 'Mateo', 'mateo@example.com', 'BS1 4DJ', 'Pro', 'active'), ('C-1004', 'Mateo', 'mateo@example.com', 'BS1 4DJ', 'Pro', 'active'), ('C-1005', 'Hana', 'hana@example.com', 'M4 1X', 'Basic', 'active');| Rule | Expected result | What it proves |
|---|---|---|
not_null on email (active rows) | Fails on C-1002 (Noor) | The completeness rule sees the blank |
unique on customer_id | Passes | The footgun: both Mateo rows carry different IDs |
unique on email | Fails on mateo@example.com | The business-key rule catches the duplicate |
| Postcode format rule | Fails on C-1005 (Hana) only | The pattern rejects "M4 1X" and accepts the other four |
| Freshness, 24-hour limit | Fails once the newest load timestamp is over 24 hours old | Backdate the timestamp in a scratch copy of the source to prove the alert fires |
| Accuracy | Cannot be planted | A wrong but plausible address passes every in-table rule, which is the point |
If a rule passes on its planted defect, the rule is wrong, not the data.
Beside the pipeline: observability
Tests only find what you thought to test for. An observability tool takes the opposite approach: it learns how often each table lands and how many rows arrive, then alerts when that pattern breaks.
It would have flagged the missing weekend loads without anyone writing a freshness rule. It would also catch a load that arrives with half its usual rows, which none of the six row-level rules would notice, because every row that did arrive is perfectly fine.
Vendors in this space draw the same line. Monte Carlo, which sells observability, says data testing helps catch specific, known problems, while observability aims at both known and unknown issues across the pipeline. Treat that as a vendor's framing.
| Question | Tests (dbt, Great Expectations, Soda) | Observability |
|---|---|---|
| What does it catch? | Defects you predicted and wrote a rule for | Unknown unknowns: pattern breaks nobody predicted |
| Who defines "wrong"? | A person, through an explicit rule and threshold | The tool, from the table's own history |
| Strength | Precise, auditable, tied to a business threshold | Broad coverage with little setup |
| Blind spot | Anything nobody thought to test | Cannot know your business rules; can raise false alarms |
| Our table | Finds Noor, Mateo, Hana and Ines once the rules exist | Finds the missing weekend loads, or a half-size load |
Two trade-offs are worth planning for. They are editorial judgments, not documented findings. First, a tool that learns normal patterns can flag harmless anomalies, so budget time to tune it. Second, a team with disciplined tests and a small, stable set of sources may reasonably decide that tests are enough. The case for observability strengthens as sources multiply, because the number of failures nobody predicted tends to grow with them.
If you are starting from nothing, put the tests in first. They are the rules you already know you need. Add observability when the unpredicted failures begin to cost you.
What neither approach can see: accuracy
Jonas moved to Leeds. No test inside the table can know that, and no anomaly detector will notice, because his row looks perfectly normal. Accuracy needs a reference, which usually means a sample check that somebody runs on purpose, on a schedule, against an authoritative source or the customer.
Advanced insight: accuracy is a relationship, not a property. A value is not accurate or inaccurate on its own. It is accurate relative to a reference. That is why accuracy always has an owner (whoever maintains the reference) and why it cannot be fully automated away.
Tests enforce the rules you know. Observability watches for the failures you did not predict. Accuracy needs a human-chosen reference.
Five failures, five dimensions: what bad data really costs
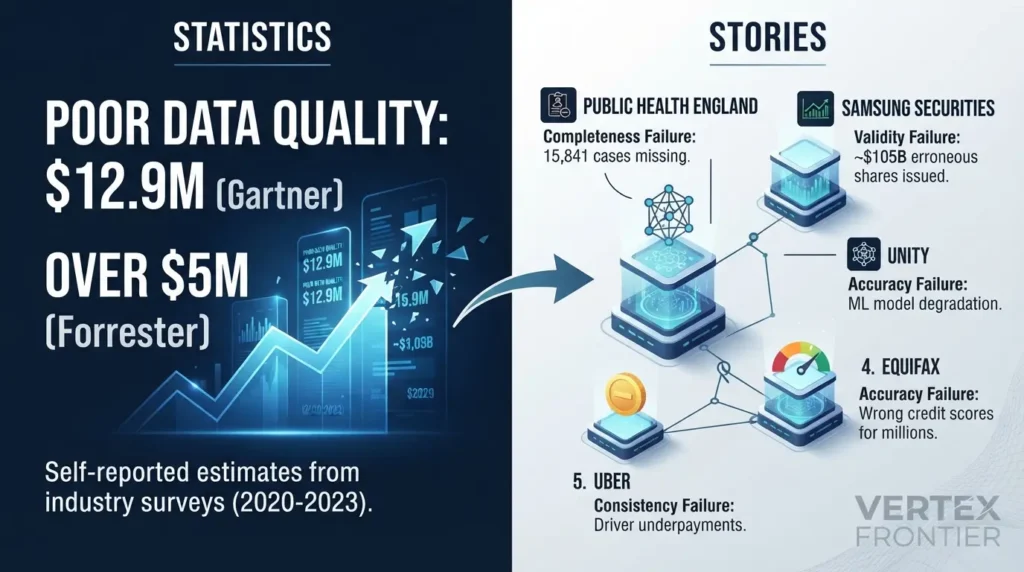
Statistics first, then stories. Gartner's headline figure is $12.9 million a year in average cost of poor data quality per organization, but the footnote on a reprint of its report page ties it to a 2020 survey of reference customers for its Magic Quadrant for Data Quality Solutions. In other words, it is an estimate from customers of data quality vendors.
A Forrester Data Snapshot from July 2024 reports that, in Forrester's 2023 Data Culture and Literacy Survey, more than a quarter of data and analytics employees who see poor data quality as an obstacle estimate their organization loses over $5 million a year, with 7% reporting $25 million or more. Both are self-reported estimates from specific groups, so read them as directional, not precise.
The cases below come from Monte Carlo's compilation of five bad-data incidents, which draws on public reporting and was last updated in October 2026. Monte Carlo sells data observability software, so weigh its conclusions accordingly. The incident facts are the useful part. The dimension labels below are this article's own classification, not the original reporting's.
| Dimension | Case | Documented impact | The rule that targets it |
|---|---|---|---|
| Completeness | Public Health England, 2020 | 15,841 positive cases missing from daily reports | Source and target row counts must reconcile |
| Uniqueness | No documented public case in this research | See Mateo's double invoice above | Unique on the business key |
| Validity | Samsung Securities, 2018 | About $105 billion in shares issued by mistake; stock fell nearly 12% | Range and unit checks at the point of entry |
| Accuracy | Unity (2022) and Equifax (2022) | About $110 million in total impact (Unity); wrong credit scores for millions (Equifax) | Reference comparison, sample audits, monitoring on inputs |
| Consistency | Uber, 2017 | At least $45 million in driver underpayments (WSJ estimate) | One agreed definition of "fare", checked against the contract |
| Timeliness | The Friday load (illustrative, not a documented company case) | 63-hour-old invoice data | Freshness with warn and error limits |
Completeness: Public Health England
Challenge. Between 25 September and 2 October 2020, 15,841 positive COVID-19 cases were missing from the daily reports compiled by Public Health England. The reporting templates used the outdated XLS spreadsheet format, which holds only around 65,000 rows per sheet (roughly 1,400 cases, as Monte Carlo puts it), while the CSV files submitted for consolidation held far more data.
Action. The write-up does not describe the fix. It notes that PHE already had plans to replace the legacy software with analytics tools better suited to the job.
Outcome. More than 50,000 potentially infectious people may have been overlooked by contact tracers, according to reporting that Monte Carlo cites from The Guardian.
Lesson. Completeness is not just "is the field null". It is "did every record make the journey". A reconciliation rule that compares source and target row counts is a cheap guard against this class of failure.
Validity: Samsung Securities
Challenge. In April 2018, an employee at Samsung Securities, the group's stock-trading arm, meant to pay a dividend worth 2.8 billion won (about $2.1 million) but mixed up the entry and issued 2.8 billion shares instead. Those shares were worth around $105 billion, roughly 30 times the number of shares actually outstanding.
Action. It took 37 minutes for the firm to realize what had happened. In that window, 16 employees sold about five million shares worth around $187 million. Regulators later barred the firm from taking new clients for six months, and co-CEO Koo Sung-hoon resigned.
Outcome. The stock fell nearly 12%, wiping out around $300 million of market value.
Lesson. Validity is about type, unit and range as much as format. A rule such as "never issue more shares than exist" is a plausibility check on the value itself, and it targets exactly this failure. The 37-minute gap teaches a second lesson: detection speed decides how much damage a bad value can do.
Accuracy, case one: Unity Technologies
Challenge. In the first quarter of 2022, Unity's Audience Pinpoint tool ingested bad data from a large customer. That caused major inaccuracies in the training sets for the predictive machine learning models behind the tool, and its performance dipped.
Action. Unity's CEO told shareholders the company was deploying monitoring, alerting and recovery systems and processes to mitigate future complex data issues.
Outcome. The company reported an impact of approximately $110 million. According to its CEO, that included the direct revenue impact, the cost of rebuilding and retraining models, and delayed launches of revenue-driving features. Its shares dropped 37%.
Lesson. Bad data stopped being an IT annoyance the moment it fed a customer-facing model. It became a board-level financial event, and the total cost included recovery work, not just lost sales.
Accuracy, case two: Equifax
Challenge. Between 17 March and 6 April 2022, Equifax issued inaccurate credit scores for millions of consumers applying for auto loans, mortgages and credit cards. For over 300,000 people the scores were off by 20 points or more. Equifax blamed a "coding issue" on a legacy on-premises server, and a source told a trade outlet that attributes such as the number of inquiries within one month were incorrect.
Action. Equifax said it was accelerating the migration of that environment to its cloud platform, which would add controls and monitoring. A class action followed.
Outcome. The stock fell about 5% after the Wall Street Journal's reporting.
Lesson. The wrong inputs were still plausible numbers, so a format check had nothing to catch. This is the accuracy gap again: only a reference comparison or a downstream signal exposes a value that is plausible and wrong. The accuracy label is editorial.
Consistency: Uber
Challenge. Uber calculated its commission on the gross fare instead of the net fare (the fare minus sales tax and other fees). For two and a half years that took 2.6% more from New York drivers than its own terms allowed. "Tens of thousands" of drivers were affected.
Action. Uber said it would repay drivers with 9% annual interest, an average of around $900 each.
Outcome. The Wall Street Journal estimated the cost at no less than $45 million.
Lesson. Monte Carlo notes that the data was not wrong in itself; the calculation was built on the wrong numbers. This article files it under consistency because the calculation and the contract used different definitions of "fare". A check against the agreed definition works best when governance has already decided which definition wins.
Every one of these failures was a rule nobody wrote or a threshold nobody owned. The data was not mysteriously bad. It was unmeasured.
Why AI raises the stakes
The old failure mode was a wrong number on a dashboard that a person might question. The new one is a model or an agent that acts on the number without anyone looking.

Three things change when AI sits downstream.
- Defects compound. A bad value can influence training data, retrieval results and automated decisions, so one error turns into many. Unity's case shows how a single ingestion defect reached a revenue-generating model.
- Plausible beats obvious. Models smooth over problems. A model trained on inconsistent data does not crash. It returns confident answers that are wrong.
- Quality becomes a documented duty. For high-risk systems, Article 10 of the EU AI Act sets data governance requirements for training, validation and testing data sets. It words the quality bar in terms of intended purpose: data should be representative and, as far as possible, free of errors and complete in view of that purpose. That is fitness for use, written into law. Our EU AI Act compliance guide walks through what it means for teams shipping models.
The same logic applies to retrieval. Poor source data cascades into poor retrieval, so the quality of what you index decides what your assistant can say. Our guide to document-level access control in RAG covers the downstream side of that pipeline.
AI does not make data quality less important because models are robust. It makes it more important because the review step has disappeared.
Who decides the threshold? Data quality inside data governance
Return to the billing run. Someone decided invoicing needs 100% on every row rule. Who?
That question is the line between two disciplines. Data governance decides the rules and who owns them. Data quality measures whether the data meets them.
| Question | Data quality | Data governance |
|---|---|---|
| Core job | Measure whether data meets the rules | Decide the rules, owners and authority |
| Typical output | Scorecards, test results, alerts | Definitions, systems of record, thresholds, ownership |
| Example from our table | Finds that Ines's plans disagree | Declares billing the system of record, so the CRM is the one that is wrong |
| Without the other | A dashboard of percentages and nobody able to say which matter | Policies that nobody measures or enforces |
Every line on the scorecard was a governance decision before it was a check:
- Someone decided a customer is identified by email. That is what turned Mateo into a duplicate.
- Someone decided billing is the system of record for plans. That turned Ines's disagreement into an answer.
- Someone chose the reference for addresses, which is what makes accuracy measurable at all.
- Someone gave the Head of Billing the authority to demand 100% for invoicing.
The standards say the same. DAMA UK's paper states that before using the dimensions at all, an organization needs to agree the quality rules the data will be assessed against, and that data of very high value in a given context may call for more rigorous rules there. ISO 8000 defines quality data as portable data that meets stated requirements, and governance is where requirements get stated. DAMA's wheel diagram is commonly described as placing data governance at the center, with data quality as one of the surrounding knowledge areas.
Warehouse-level rules such as partitioning, materialization and system-of-record decisions come up constantly in hiring. Our 40+ data warehouse interview questions cover them.
Thresholds are SLAs, and SLAs need owners
A threshold with no owner is decoration. Treat each one as a service-level agreement: it has an owner, a review date, and a change log. Thresholds drift otherwise. A line set at 100% in month one is relaxed to keep a pipeline green, and nobody re-approves it.
Data contracts are an emerging enforcement layer. Acceldata, a data observability vendor, describes a data contract as a formal agreement between data producers and consumers covering structure, semantics, quality SLAs and controlled change. Its warning is worth repeating: contracts fail most often because accountability is unclear, not because tooling is missing. Treat this as one vendor's framing of an evolving practice, not a settled standard.
Here is what the billing run looks like as a quality contract. Engineering owns the checks. The business owns the thresholds.
| Dimension | Rule and denominator | Threshold | Threshold owner | If breached |
|---|---|---|---|---|
| Completeness | Email present, active customers | 100% | Head of Billing | Hold those rows from the run |
| Uniqueness | One row per email, all rows | 100% | Head of Billing | Merge duplicates before the run |
| Validity | Postcode matches format, all rows | 100% | Head of Billing | Route to data correction |
| Accuracy | Address confirmed in a monthly random sample | Zero failures in the sample | Head of Billing | Trigger a wider correction sweep |
| Consistency | CRM plan equals billing plan, rows in both | 100% | Head of Billing | Billing wins; fix the CRM record |
| Timeliness | Data age at the start of the run | 24 hours or less | Head of Billing | Hold the run; page the on-call engineer |
Governance is the long pole, not tooling. Leadership will often fund a tool before it funds the cross-team time needed to agree thresholds. Without that agreement, the best test suite is measuring against nothing.
Common data quality mistakes (and how to avoid them)
Most data quality programs fail in the gap between a tutorial and production. These are the mistakes that show up again and again.
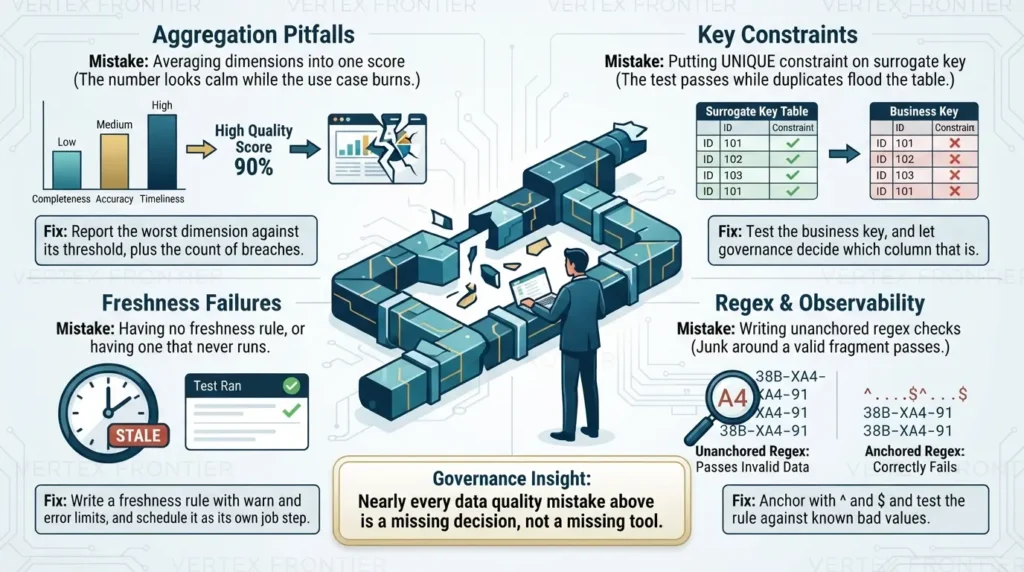
Averaging dimensions into one score
The number looks calm while the use case burns.
Fix: report the worst dimension against its threshold, plus the count of breaches.
Putting unique on the surrogate key
The test passes while duplicates flood the table.
Fix: test the business key, and let governance decide which column that is.
Copying a default mostly value
A value like 0.95 quietly accepts one bad row in twenty.
Fix: pick the value per use case, and state how many rows it allows.
Having no freshness rule, or having one that never runs
Dashboards go stale while every test passes.
Fix: write a freshness rule with warn and error limits, and schedule it as its own job step.
Writing unanchored regex checks
A pattern can match anywhere in the string, so junk around a valid fragment still passes.
Fix: anchor with ^ and $, and test the rule against a known bad value such as "M4 1X".
Reading "tests pass" as "data is good"
Tests prove only the defects you predicted.
Fix: add observability for the unpredicted, and a scheduled sample audit for accuracy.
Leaving thresholds without an owner
Nobody can approve a change, so the number drifts.
Fix: give every threshold an owner and a review date.
Skipping the denominator
"95% complete" is meaningless until you say which rows count.
Fix: write the denominator beside the rule, and decide whether closed or test records are in or out.
Nearly every mistake above is a missing decision, not a missing tool.
Before and after: from "tests pass" to "owned thresholds"
Here is the same team, in the same scenario, before and after the changes in this guide. It is an illustration of how the pieces fit together, not a measured result from a real project.
- dbt tests run
uniqueandnot_nulloncustomer_id. Everything is green. - The dashboard shows one blended 95% score.
- No freshness rule exists. The weekend loads fail without a sound.
- Finance finds the problems on Monday afternoon, from a bounced invoice and a double charge.
- Nobody can say who sets the pass line.
- Uniqueness runs on email, plus a postcode format test and a CRM-to-billing consistency query.
- A 24-hour freshness rule trips on Saturday evening and pages the on-call engineer.
- Observability watches load volume for half-size batches.
- A contract names the Head of Billing as threshold owner, and the dashboard shows the worst dimension and breach count.
- The invoice run starts on fresh data. Flagged rows are held. A monthly audit catches the Jonas-style address errors.
The difference is not a smarter tool. It is that every failure now has a rule, a number and a person attached.
Where to start
If you take only one step from this guide, take this one: pick one table and one use case, and write the five-part rule for each dimension that use case depends on.
Then run through this checklist:
- Can you name the use case the table serves, and the person who can accept its thresholds?
- Does each rule have an explicit denominator?
- Does unique run on the business key, not just the ID?
- Is there a freshness rule, and does it run on a schedule?
- Is accuracy audited against a reference, on purpose, on a calendar?
- Does your dashboard show breaches against thresholds instead of one average?
Data quality starts as a measurement problem and ends as a decision problem. The tools can tell you how fit the data is. Only people can say what it needs to be fit for. If you are hiring or interviewing for the role that owns these checks, work through our 41 data engineering interview questions, several of which cover data quality scenarios directly.
Frequently asked questions
What is data quality?
Data quality is how well data fits the job it is used for, an idea known as fitness for use. It is measured one dimension at a time, such as completeness or timeliness, against thresholds set by each use case. The same table can therefore pass for one team and fail for another.
What are the six dimensions of data quality?
They are completeness, uniqueness, validity, accuracy, consistency and timeliness, as set out in DAMA UK's 2013 paper and recommended by the UK Government Data Quality Hub. They ask whether data is present, recorded once, well formed, true, in agreement across systems, and fresh enough for the moment it is used.
How do you measure data quality?
Name the dimension, write a rule, choose the denominator, set a threshold for one use case, and assign an owner. Most dimensions are a pass rate: rows that pass divided by rows checked. Timeliness is measured as data age in hours against an agreed limit.
Why does a unique ID column not guarantee uniqueness?
An ID column only proves that each row has a different ID. If the same person signs up twice and receives two IDs, the test still passes. Test uniqueness on the business key that really identifies the thing, such as email, and let governance decide which column that is.
What is the difference between data quality and data governance?
Data governance decides the rules, definitions, systems of record and owners. Data quality measures whether the data meets those rules. DAMA's wheel diagram is commonly described as placing governance at the center, with data quality as one of the surrounding knowledge areas.
Are dbt tests enough, or do I need data observability?
Tests catch defects you predicted and wrote rules for. Observability tools aim at the ones you did not predict, such as a missed load or a half-size batch. Some small teams manage with tests alone, but most stacks benefit from both, and neither can verify accuracy without a reference.
What does mostly mean in Great Expectations?
In Great Expectations, mostly is a float between 0 and 1 on column-level expectations. The expectation succeeds when at least that fraction of rows passes, so mostly=0.95 tolerates 5% bad rows. It works as a threshold, so the use-case owner should choose it rather than copying a default.
Should every data quality threshold be 100%?
No. A threshold should reflect what the use case can tolerate. UK Government guidance says checks should describe typical good quality rather than rules every value must meet, and uses a 98% target for an animal date-of-birth check as its example. Money-moving uses such as invoicing may justify 100% on row-level rules, but that is a decision for the use-case owner.

Was this article helpful?






[…] useful answer names dimensions such as freshness, completeness, validity, uniqueness, consistencyand fitness for the consumer’s […]
[…] verifies that data moves from source to target with the expected structure, transformations, completeness, accuracy, freshness, and failure […]
[…] access works, and owners respond when data changes. Translating ‘quality’ into measurable dimensions — completeness, uniqueness, validity, accuracy, consistency, and timeliness — is what turns a vague control into one a team can actually […]
[…] handling is the uniqueness dimension of data quality , and like every dimension, it needs a measurable rule, not just an engine […]