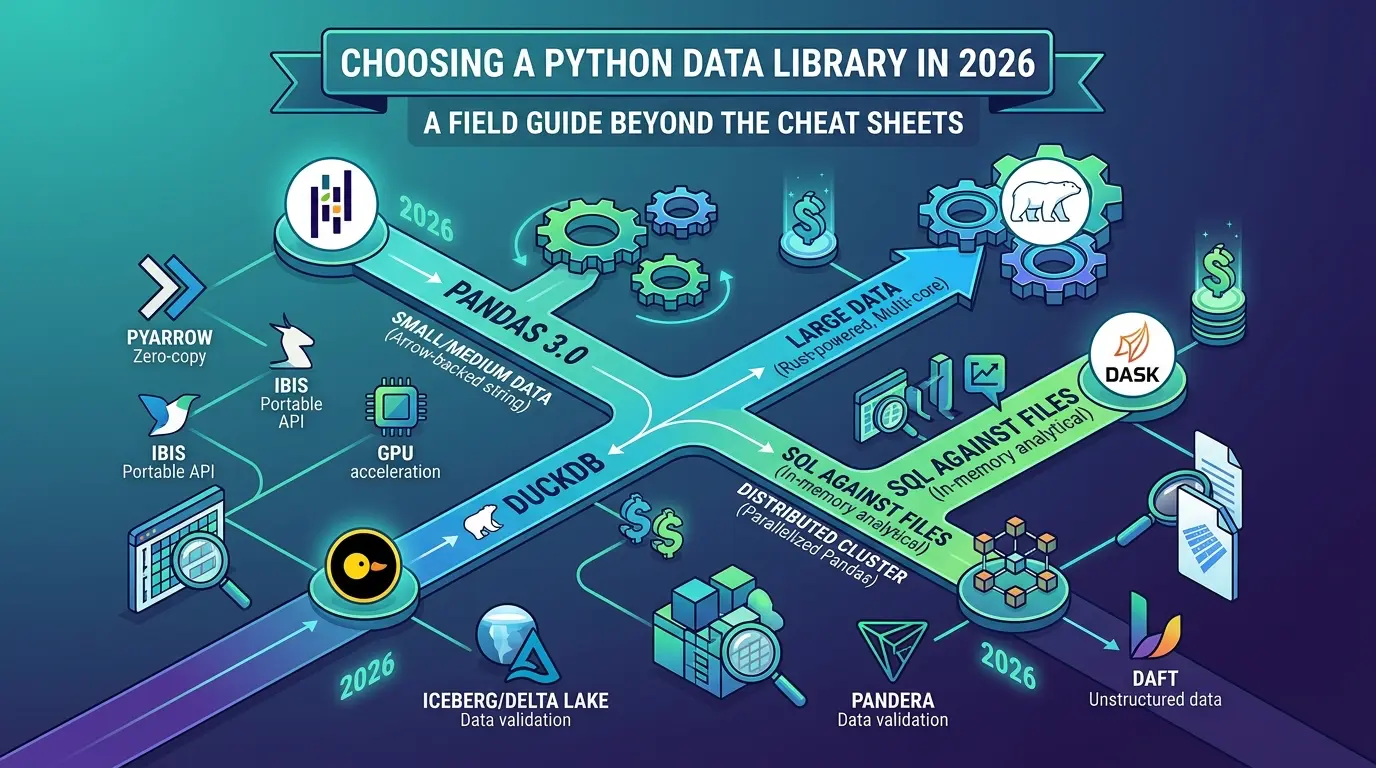

Most “which Python library should I use” articles answer a question nobody actually has. They tell you Pandas is for tables and Matplotlib is for charts, as if the problem was ever knowing what each library does. It isn’t. The problem is that you have a 40 GB Parquet file, a deadline on Friday, and four tools that could plausibly do the job, and picking wrong costs you a rewrite two months from now.
This guide skips the tour of icons and feature lists. It’s built around the decision itself: what changes in your actual workflow when you pick Pandas over Polars, or Plotly over Altair, and where teams have gotten that decision expensively wrong.
What you’ll walk away with
Click any topic to expand or collapseData scale threshold & row-count decision rule
A rule of thumb for when dataset size and row count alone should determine your dataframe or query library choice.
Independent benchmarks (Pandas vs. Polars vs. DuckDB)
Real benchmark performance numbers — stripped of vendor marketing bias — comparing Pandas, Polars, and DuckDB across execution times and memory overhead.
Production case studies with before/after metrics
Four real production case studies detailing architectural migrations, along with exact before and after throughput and latency numbers.
Interactive stack decision tool
An interactive decision shortcut tool to rapidly evaluate and match your specific data pipeline parameters to the optimal engine.
Common data engineering time-sink mistakes
The silent implementation traps and anti-patterns that waste the most engineering hours during pipeline optimization.
Cloud compute infrastructure cost analysis (AWS pricing)
A real dollar-for-dollar cost comparison using published AWS EC2 and memory instance pricing rather than theoretical vendor claims.
Advanced data stack (Ibis, GPU, Iceberg, Pandera, Daft)
Where Ibis, GPU acceleration, Iceberg/Delta Lake table formats, Pandera data validation, and Daft distributed engines fit for mature data teams.
Out-of-core memory management realities
The technical realities of out-of-core processing and disk streaming that most “Polars beats everything” marketing claims gloss over.
The Question That Actually Matters: Size, Not Preference
Here's the uncomfortable part: almost none of the popular comparisons ask about data size first, even though it's the single biggest factor in whether a library will feel fast or feel broken.
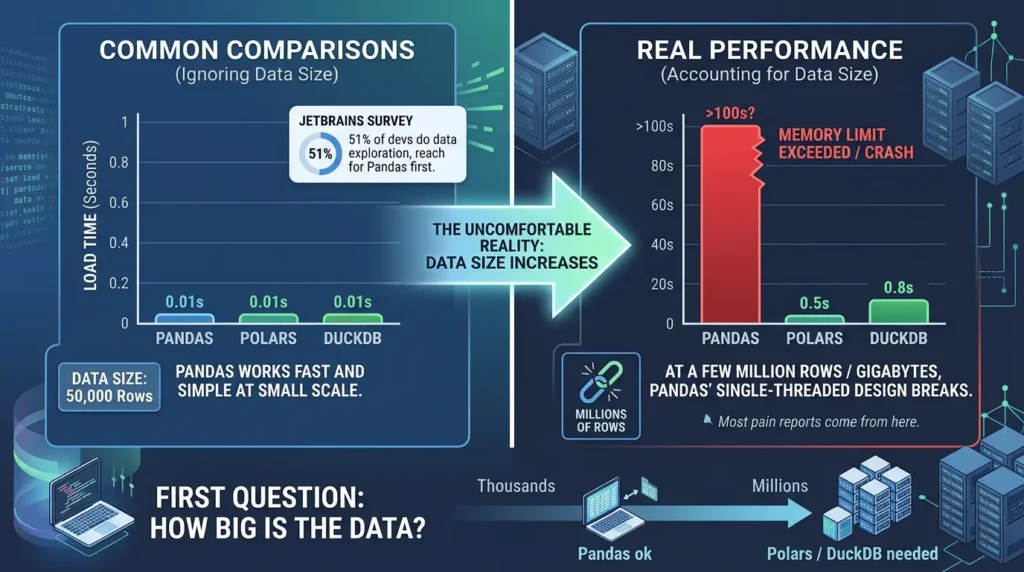
A one-person team pulling 50,000 rows from an API doesn't need to think about any of this. Pandas will do it in the time it takes to type the import statement, and reaching for Polars or DuckDB at that scale is solving a problem you don't have.
The moment it stops being simple is somewhere around a few million rows, or a few gigabytes on disk, the exact point where Pandas' single-threaded, in-memory design starts working against you instead of for you. According to the JetBrains State of Python 2025 survey, 51% of Python developers now do some form of data exploration or processing, and Pandas and NumPy remain the two tools they reach for first, which also means most of the pain reports about "Pandas is too slow" are coming from that exact group hitting that exact wall.
So the real first question isn't "which library is best." It's: how big is the data, and how much of your workflow depends on things Pandas already does well, matplotlib plotting, scikit-learn feeding, ad-hoc notebook exploration? The answer changes the recommendation completely, and that's the frame the rest of this guide uses.
Data Wrangling: Pandas, Polars, PyArrow, Dask, and DuckDB
This is where the real decision gets made, because this category has the most overlap and the most expensive mistakes.
Pandas is still the default, and that's a bigger deal than it sounds
Pandas just went through its biggest architectural shift in a decade. Pandas 3.0, released January 21, 2026, made copy-on-write the default behavior across the board, eliminating the notorious SettingWithCopyWarning, and replaced the old catch-all object dtype for text with a dedicated, Arrow-backed string type. In practice that means string operations,.str.contains(), .str.replace(), .str.split(), run noticeably faster with no code changes required, and DataFrames stop silently duplicating memory behind your back.
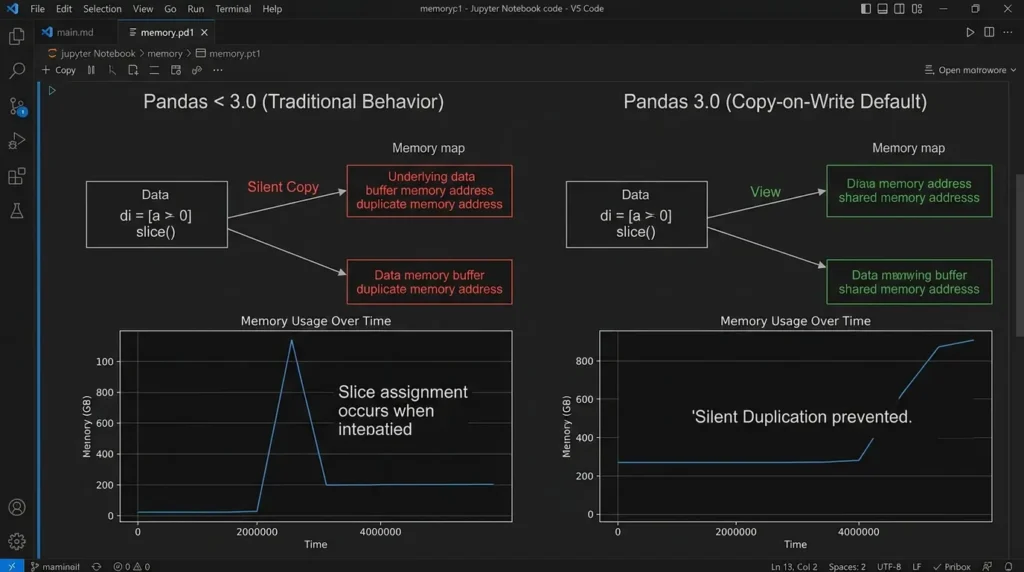
That release matters for this guide because it closes part of the gap that used to be the strongest argument for switching away. If your workload is small-to-medium, lives comfortably in a notebook, and needs to plug into Matplotlib, Seaborn, or scikit-learn without friction, Pandas 3.0 is a meaningfully better version of the tool you already know, not a reason to look elsewhere.
It also picked up a smaller, quieter change worth knowing about: a new pd.col() expression syntax that lets you write column transforms declaratively instead of reaching for a lambda, a page taken directly from Polars' own expression API, and a sign the two libraries are converging in places even as they compete in others.
Python Code — Pandas 3.0, cleaning and aggregating sales data:
import pandas as pd
df = pd.read_csv("sales.csv") # strings now infer as Arrow-backed str dtype automatically df = df.dropna(subset=["order_id"]) monthly = ( df.groupby(df["order_date"].dt.to_period("M"))["revenue"] .sum() .reset_index() ) print(monthly)
Polars: the honest performance story
Polars is a DataFrame library written in Rust that spreads work across every CPU core instead of running single-threaded like classic Pandas. The headline numbers are real, but they're also more conditional than most blog posts admit.
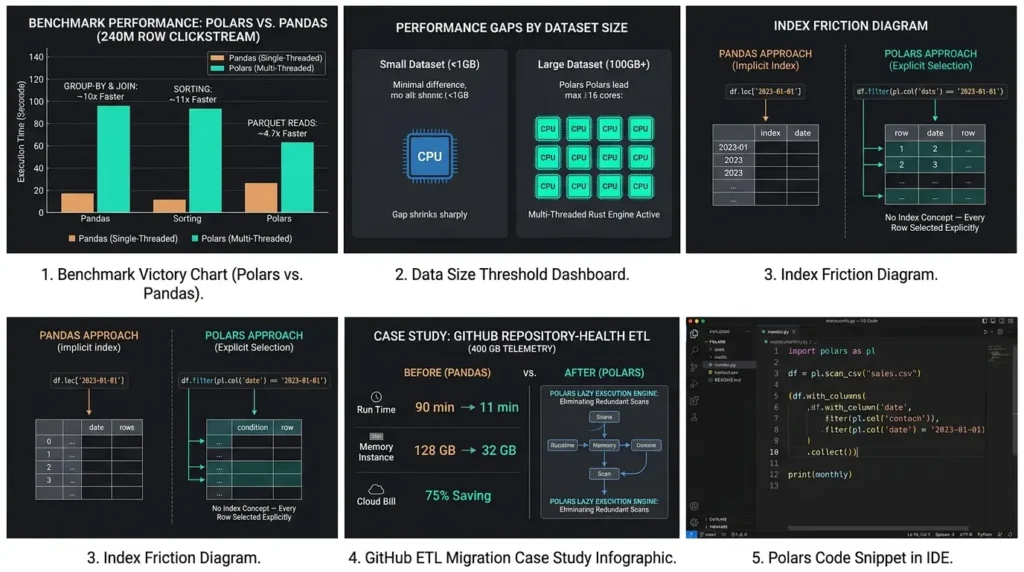
An independent benchmark run on a 240-million-row clickstream dataset found Polars delivering roughly 10x speedups on group-bys and joins, up to 11x on sorting, and about 4.7x faster Parquet reads compared to Pandas, but the same test found the gap shrinks sharply on datasets under 1 GB, and largely disappears for heavy string manipulation, where Pandas 3.0's new Arrow-backed strings hold their own.
The pattern repeats across independent tests: Polars wins decisively above roughly a gigabyte, and the win gets bigger as the data grows, because Pandas 3.0's Copy-on-Write mode still processes on a single thread underneath the improvements.
df.loc[label], aligning two Series by their index before an operation, setting a column as the index for fast lookups. Polars and DuckDB don't have that concept at all. Every row is selected explicitly, by position or by a filter condition, never by an implicit label. This is why porting an existing Pandas script rarely goes line-by-line: any code that leans on index alignment, .reindex(), or a datetime index for resampling has to be re-thought, not just retyped. It's the single biggest reason a "quick" migration estimate usually runs long.Where this played out for real: engineers at GitHub described migrating a nightly repository-health ETL job, about 400 GB of telemetry processed every night, from Pandas to Polars. On Pandas, the job needed a memory-heavy 128 GB instance and took 90 minutes to run. After the migration, it ran on a much smaller 32 GB instance in 11 minutes, cutting the processing window by more than 8x and the cloud bill by roughly three-quarters. The team credited Polars' lazy execution engine with eliminating redundant scans that Pandas had quietly been repeating on every run.
That's a substantial win, but it's also a nightly batch job with no interactive debugging, no live notebook exploration, and no downstream dependency on scikit-learn's Pandas-first API. That combination is exactly where Polars is built to win, and exactly why the same migration doesn't automatically make sense for a team doing exploratory analysis in Jupyter every day.
Python Code — the same aggregation in Polars:
import polars as pl
df = pl.scan_csv("sales.csv") # lazy: nothing runs yet monthly = ( df.with_columns(pl.col("order_date").dt.truncate("1mo").alias("month")) .group_by("month") .agg(pl.col("revenue").sum()) .collect() # execution happens here, across all CPU cores ) print(monthly) DuckDB: SQL against your files, no server required
DuckDB is an embedded analytical database, it runs inside your Python process, needs no server, and lets you write plain SQL directly against CSV files, Parquet files, or an existing Pandas DataFrame. It has quietly become the tool teams reach for when a task is "really just a SQL query" but the data happens to live in files instead of a warehouse.
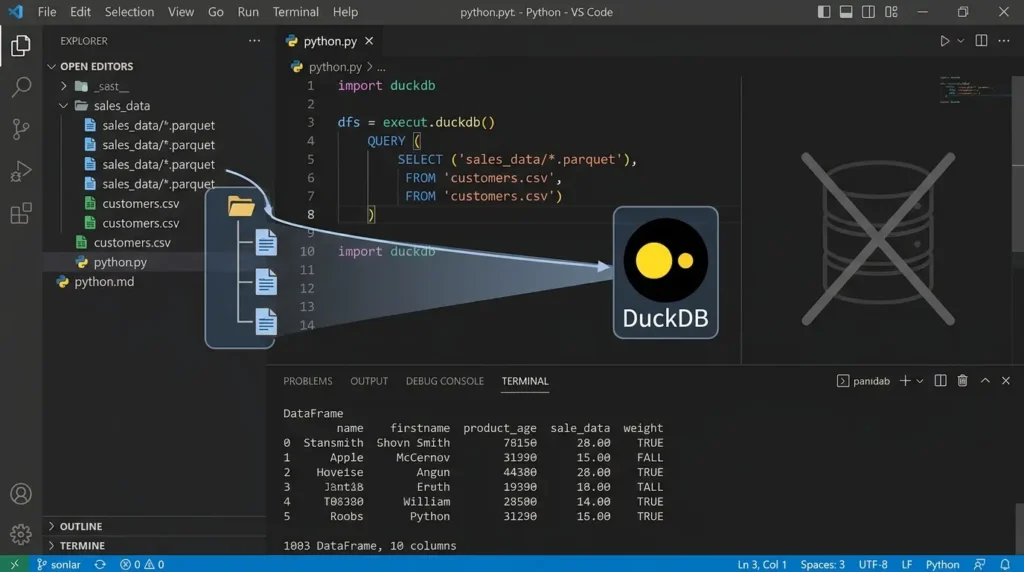
The clearest real-world number comes from a fintech company called FinQore, documented by MotherDuck's production case-study collection: migrating a reporting pipeline off Postgres and onto DuckDB cut processing time from eight hours down to eight minutes, a 60x improvement, simply by moving analytical queries off a row-oriented transactional database and onto a columnar engine actually built for scanning and aggregating.
DuckDB's adoption curve backs this up. It crossed 30,000 GitHub stars in mid-2025 and jumped from 1.4% to 3.3% usage in the Stack Overflow Developer Survey, landing at #4 among databases overall, a fast climb for a project that's still young.
Pick DuckDB when: you need SQL joins and aggregations against files or a mix of files and DataFrames, and you don't want to stand up a database server to get them. One caveat worth knowing: DuckDB's own SQL dialect is closer to standard ANSI SQL than Polars' newer, more limited SQL context, if your analysts think in SQL first, DuckDB tends to feel more natural to hand them.
One more honest caveat: DuckDB isn't immune to running out of memory either, some multi-table joins, PIVOT operations, and in-memory-mode sessions (as opposed to a persistent database file) can still fail if disk spilling isn't configured. If a job is reliably larger than RAM, explicitly setting SET memory_limit='50GB'; and pointing temp_directory at fast SSD storage is worth doing deliberately rather than assuming it'll just work.
The same memory/spilling trade-off exists at the database host layer, where PostgreSQL and ClickHouse rely on Linux dirty writeback and swap behavior, our Linux vm.swappiness and dirty ratios for PostgreSQL and ClickHouse guide covers that side of the equation.
PyArrow: the format everyone else is quietly built on
PyArrow rarely gets chosen directly by a beginner, but it's worth understanding because it's the columnar memory format Pandas 3.0's new string type, Polars, and DuckDB all speak natively. When you convert between these tools with .to_arrow() or read a Parquet file, PyArrow is usually the reason it happens with zero data copying. If you're moving large columnar datasets between tools rather than manipulating them yourself, PyArrow is the layer that's actually doing the heavy lifting.
Dask: parallelism without leaving the Pandas API
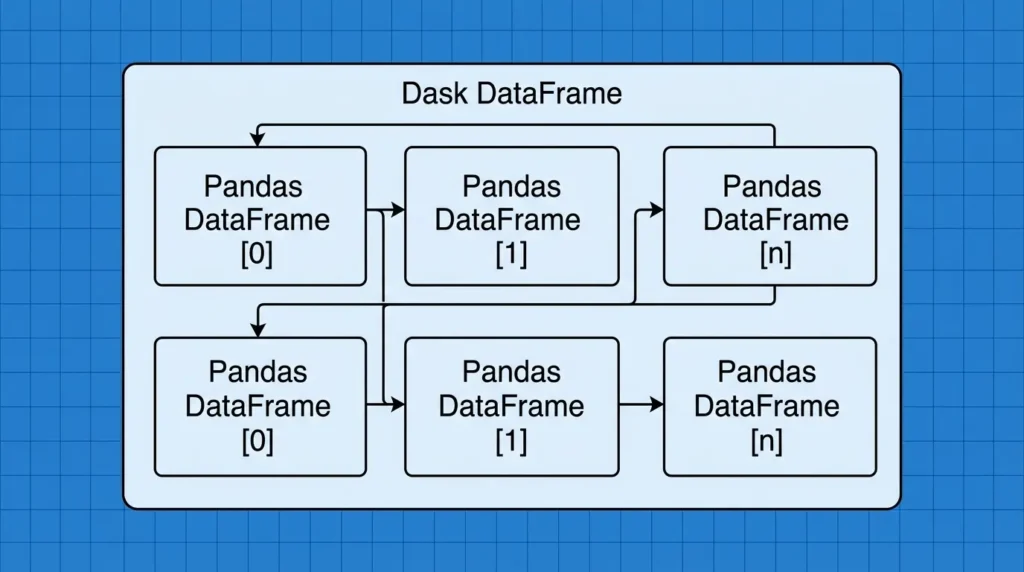
Dask takes a different approach entirely: instead of replacing Pandas, it wraps it. A Dask DataFrame is really a collection of smaller Pandas DataFrames, partitioned and processed across cores, or across an entire cluster, while your code keeps looking almost identical to standard Pandas.
Dask earns its place when a dataset doesn't fit in memory on one machine, or when the same pipeline needs to scale from a laptop to a cluster without a rewrite. Capital One's engineering team documented exactly that shift: after adopting Dask and RAPIDS to scale existing Pandas and scikit-learn workflows, they reported that early implementations of Dask cut model training times by 91% within a few months, without retraining their data scientists to write Spark or Java.
Wikipedia's documentation on the project also lists Walmart, NASA, Wayfair, and General Motors among organizations running Dask in production, a broader footprint than Polars or DuckDB currently claim, largely because Dask has had a longer head start.
The honest trade-off: Dask adds real overhead on small datasets, a job that fits comfortably in memory will often run slower under Dask than under plain Pandas, because of the coordination cost of building and scheduling the task graph. It earns its keep specifically at the scale where a single machine's RAM becomes the bottleneck.
Visualization: Matplotlib, Seaborn, Plotly, and Altair
Visualization tools split along one axis that most comparisons blur: are you building a static chart for a report, or an interactive one someone will click through?
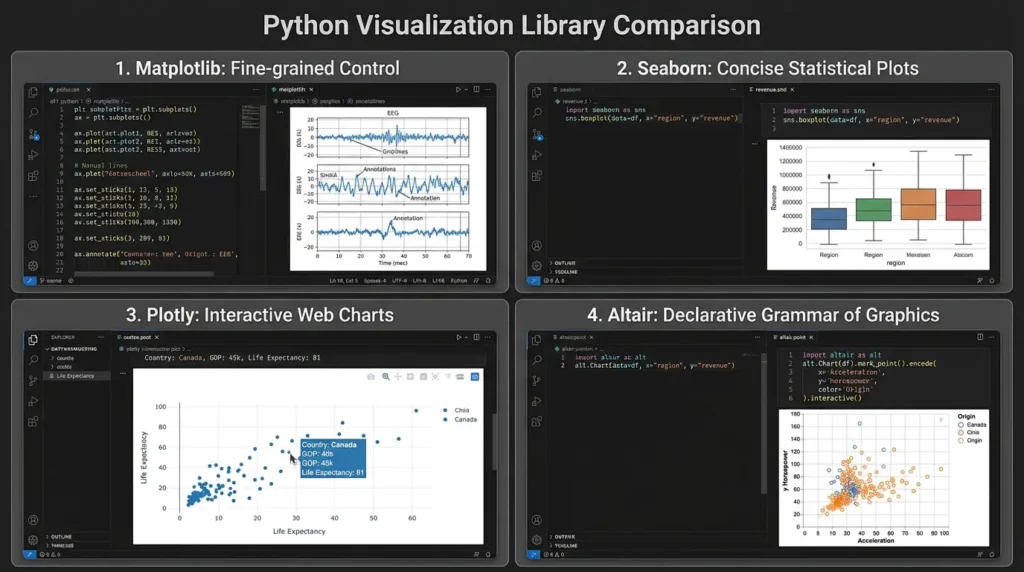
Matplotlib is the low-level foundation almost every other Python plotting library sits on top of. It's verbose and the defaults are famously plain, but it gives you control over literally every pixel, tick marks, subplot spacing, annotation placement, which is exactly why it's still the choice for publication-quality figures and custom scientific plots that need to look a specific way.
Seaborn sits directly on top of Matplotlib and trades some of that control for speed. A statistical chart, a box plot split by category, a correlation heatmap, a distribution with a fitted curve, that takes fifteen lines in raw Matplotlib often takes two in Seaborn.
Python Code — Seaborn, a boxplot in two lines:
import seaborn as sns
sns.boxplot(data=df, x="region", y="revenue")
Plotly is the pick when the chart needs to survive contact with an actual user, hover tooltips, zoom, clickable legends, filters. It's also the visualization layer most Streamlit dashboards default to, because its charts render natively in a browser without extra plumbing.
Altair takes a declarative approach borrowed from the Grammar of Graphics: instead of issuing plotting commands, you describe the relationship between your data and the visual encoding, and Altair figures out the rendering. It produces clean, consistent charts with less code than Plotly for similar output, the trade-off is a smaller community, which means fewer Stack Overflow answers when something breaks.
The uncommon opinion here: most teams don't actually need to choose between Plotly and Altair, they need to decide whether their audience is technical. Altair's declarative syntax is genuinely faster to write once you know it, but it asks more of the reader mentally. Plotly's chart objects map more directly onto "what you'd say out loud," which matters when non-technical stakeholders are the ones opening the notebook.
Take the 2026 Python Data Stack Field Kit With You
Keep this complete reference pack handy for your team — optimized for fast offline lookup during architecture planning and code migrations.
- Pandas 3.0 vs. Polars vs. DuckDB side-by-side syntax cheatsheet
- Out-of-core memory spilling & GPU acceleration trigger points
- AWS instance memory-cost savings breakdown & checklist
Scientific Computing and Machine Learning: NumPy, SciPy, Statsmodels, and Scikit-learn
This layer is less contested than data wrangling because the boundaries are cleaner.
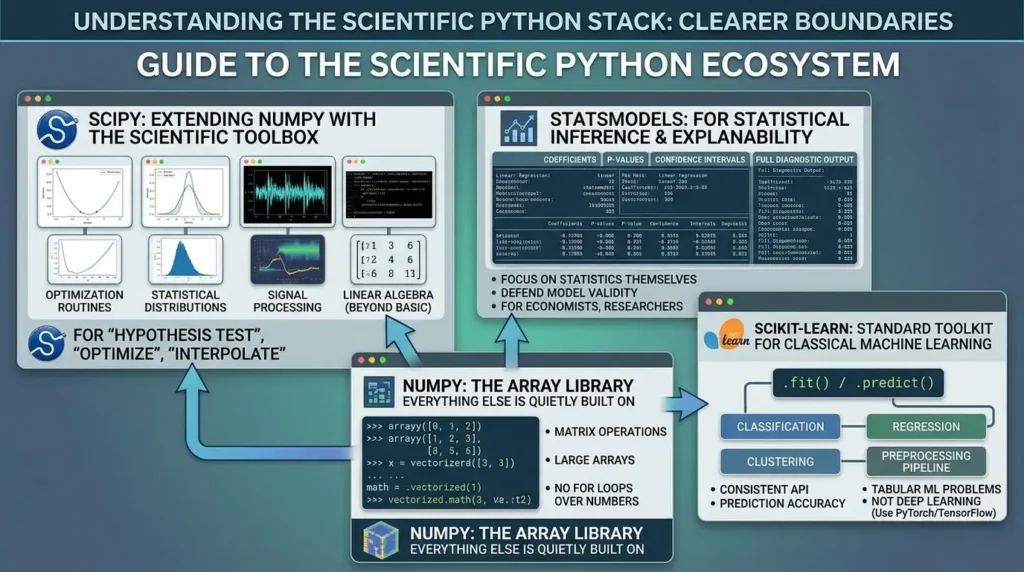
NumPy is the array library everything else in this list is quietly built on, Pandas, SciPy, and scikit-learn all use NumPy arrays under the hood. Reach for it directly when you're doing raw numerical computation: matrix operations, vectorized math across large arrays, anything where you'd otherwise be writing a Python for loop over numbers.
SciPy extends NumPy with the actual scientific toolbox, optimization routines, statistical distributions, signal processing, linear algebra beyond basic matrix multiplication. If a task description includes the words "hypothesis test," "optimize," or "interpolate," SciPy is usually the right search term.
Statsmodels is the library for when the point of the analysis is the statistics themselves, not a prediction. Linear regression in scikit-learn gives you coefficients and a prediction; the same regression in Statsmodels gives you p-values, confidence intervals, and full diagnostic output. Economists, researchers, and analysts who need to defend a model's statistical validity, not just its accuracy, tend to live here.
Scikit-learn is the standard toolkit for classical machine learning: classification, regression, clustering, and the preprocessing pipeline around them, all behind one consistent .fit() / .predict() interface. It doesn't do deep learning, that's PyTorch or TensorFlow's job, but for the large majority of real-world tabular ML problems, scikit-learn is still where teams start, in part because that consistent API means switching between a random forest and a logistic regression is a one-line change.
Spreadsheets and Shareable Apps: OpenPyXL and Streamlit
Not every data task ends in a chart or a model. Sometimes it ends in an Excel file someone in finance needs by Monday, or a tool three other people on your team need to click through without installing Python.
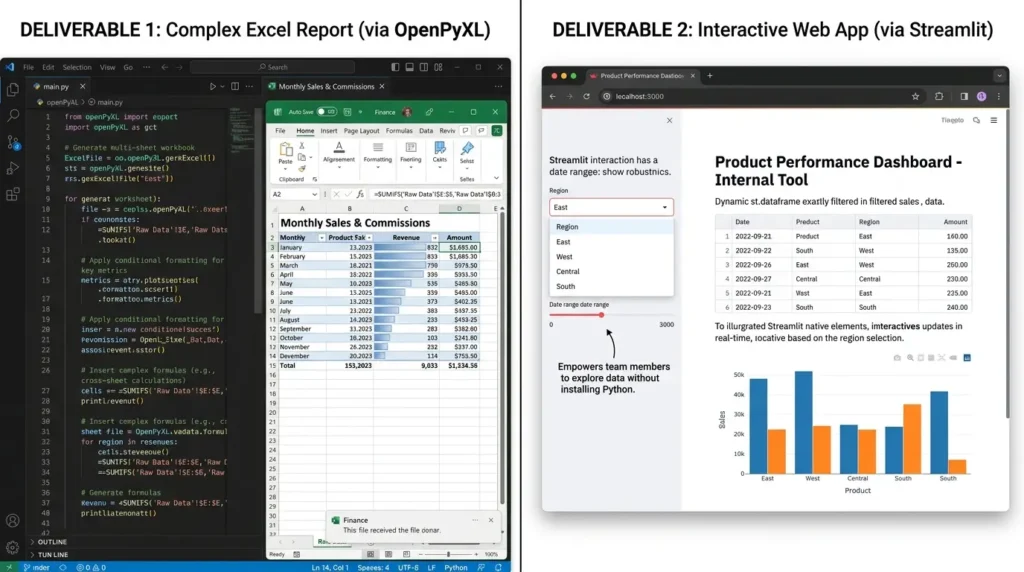
OpenPyXL reads, writes, and edits .xlsx files directly, formulas, formatting, conditional formatting, multiple sheets, which makes it the right tool whenever the actual deliverable is a spreadsheet, not just data that happens to be shaped like one.
Streamlit turns a Python script into a browser-based interactive app with almost no front-end code. Its trajectory is a useful signal on its own: Snowflake acquired Streamlit in 2022 for roughly $800 million, and by 2026 had built more than 500 internal Streamlit apps across over 70 teams, security dashboards, financial reporting tools, product metrics, with those apps now accounting for over half of all internal Streamlit traffic at the company.
That's not a toy-project statistic; it's a large enterprise treating Streamlit as core internal infrastructure, which is the strongest evidence you'll find that it holds up past the demo stage.
Python Code — a minimal Streamlit filter app:
import streamlit as st import pandas as pd
df = pd.read_csv("sales.csv") region = st.selectbox("Region", df["region"].unique()) st.dataframe(df[df["region"] == region])
Honorable Mentions: What the 2026 Stack Adds Beyond the Basics
The tools above cover what almost every team needs. A smaller set of teams, usually ones with real production pipelines or specific infrastructure, run into five more pieces worth knowing exist, even if you never touch them yourself.
Ibis: stop betting your codebase on one engine
Every recommendation in this guide so far assumes you're picking one engine and writing code against it directly. Ibis exists because that bet doesn't always pay off. It's a Python dataframe API, backed by the team behind Apache Arrow, that compiles the same code down to more than 20 different backends, DuckDB, Polars, Snowflake, BigQuery, Spark, and others, without you rewriting anything when the backend changes.
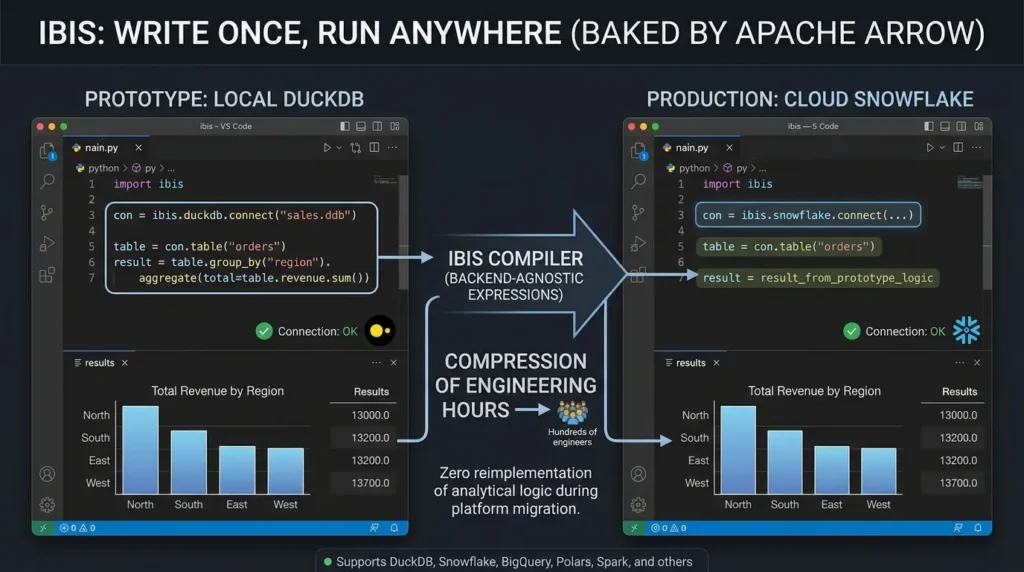
The practical case for it shows up during growth, not at the start. A team often prototypes locally against DuckDB, then needs the same logic running against Snowflake or BigQuery in production six months later. One infrastructure write-up on Ibis frames the trade-off plainly: when analytical logic is tightly coupled to one specific engine, a platform migration can burn hundreds of engineering hours reimplementing computation that hasn't conceptually changed at all.
Python Code — one Ibis expression, two backends:
import ibis
Point at a local DuckDB file for development
con = ibis.duckdb.connect("sales.ddb") table = con.table("orders") result = table.group_by("region").aggregate(total=table.revenue.sum())
Same expression, pointed at Snowflake in production —
no change to the aggregation logic itself
con = ibis.snowflake.connect(...)
Worth it when: your team genuinely expects to change backends, moving from a laptop prototype to a cloud warehouse, or migrating platforms for cost reasons. Not worth the extra abstraction layer if you know you're staying on one engine indefinitely.
GPU acceleration: cudf.pandas and the Polars GPU engine
Everything about Polars and Dask in this guide is about spreading work across CPU cores. NVIDIA's RAPIDS project takes a different axis entirely: it runs your existing Pandas code on a GPU instead, and this is the part that surprises people, it does it with a single import, not a rewrite.
Python Code — enabling GPU acceleration for existing Pandas code:
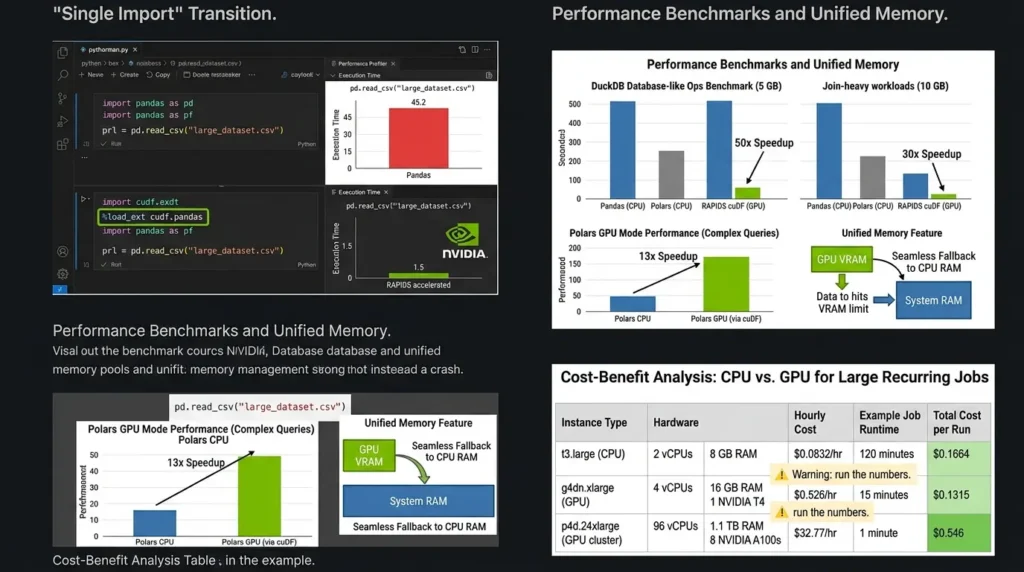
# Add this one line before your normal imports — nothing else changes %load_ext cudf.pandas import pandas as pd
df = pd.read_csv("large_dataset.csv") # now runs on GPU where beneficial
The published numbers are large enough to sound like marketing, but they come from NVIDIA's own reproducible benchmarks: up to 50x speedups on the standard DuckDB Database-like Ops Benchmark at 5 GB scale using consumer-accessible L4 GPUs, and separately, up to 30x speedups on 10 GB join-heavy workloads using cuDF's unified memory feature, which automatically falls back to the CPU when a dataset outgrows GPU memory instead of crashing. Polars picked up the same underlying engine in 2025: its GPU mode, powered by RAPIDS cuDF, delivers up to 13x speedups over CPU-only Polars specifically on complex group-by and join queries.
The real constraint isn't the code, it's the hardware. None of this helps without an NVIDIA GPU, and GPU cloud instances cost meaningfully more per hour than the CPU instances in the pricing table below. Run the numbers before assuming a GPU is cheaper, it usually only wins once a job is both large and recurring enough that the per-hour premium is outweighed by the drop in run time.
Modern table formats: Iceberg and Delta Lake, natively
This guide has talked about CSV and Parquet so far because that's still what most individual analysts touch directly. Production data platforms increasingly don't hand you a Parquet file at all, they hand you a table in Apache Iceberg or Delta Lake, open formats that add ACID transactions, schema evolution, and time travel on top of Parquet's storage layer.
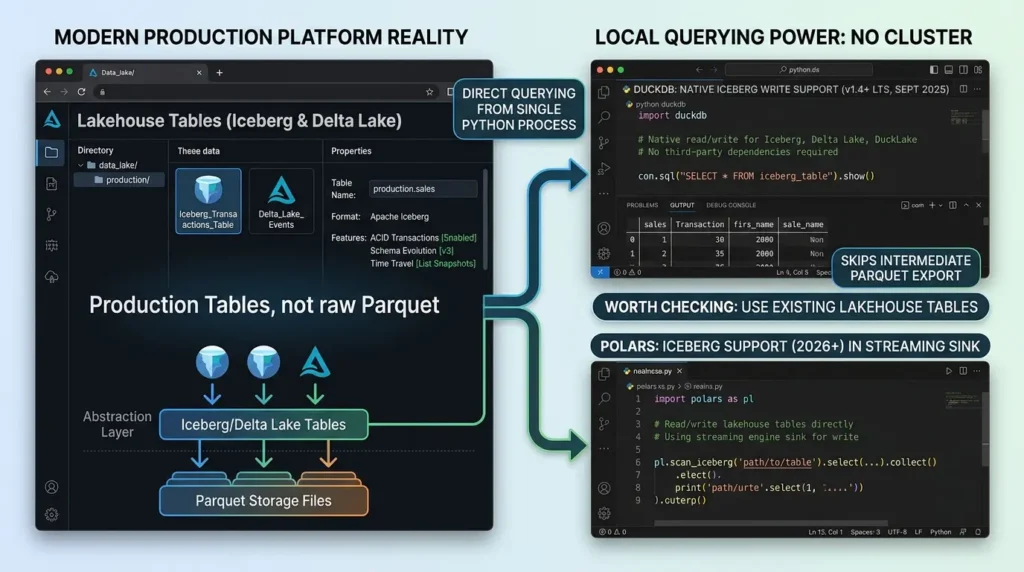
The good news: you no longer need Spark to read one. DuckDB added native Iceberg write support in its 1.4 LTS release (September 2025), and treats Iceberg, Delta Lake, and its own DuckLake format as first-class citizens with no third-party dependencies required. Polars followed with Iceberg support in its streaming engine's sink operations in 2026, meaning both tools can now read and write lakehouse tables directly from a single Python process, no cluster required for what used to be exclusively Spark or Flink territory.
Worth checking before you build a custom export step: if your organization already stores data in Iceberg or Delta Lake, both DuckDB and Polars can likely query it directly, skipping an intermediate Parquet export entirely.
Pandera: catching bad data before it reaches the model
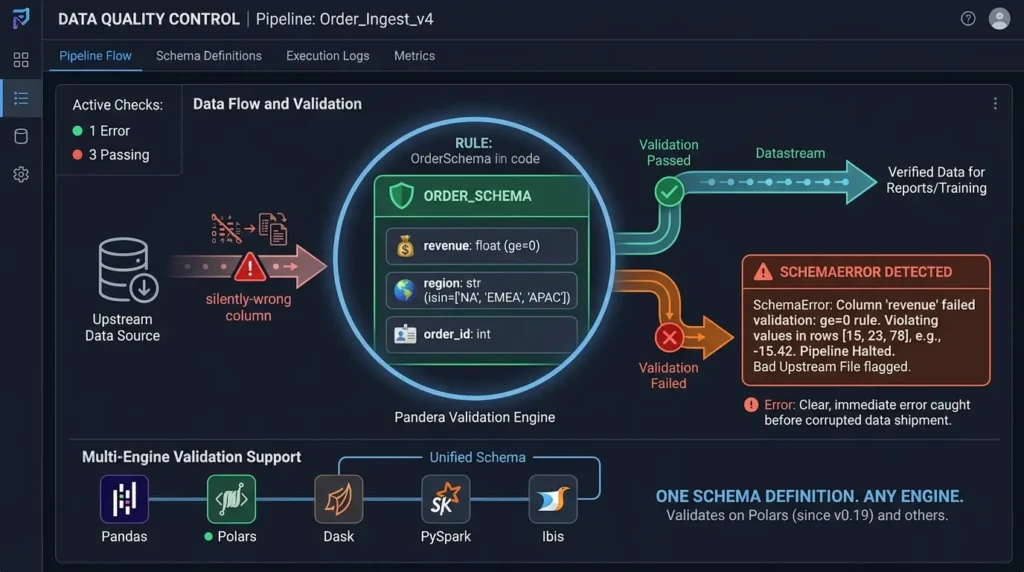
Everything else in this guide assumes the data is roughly correct. Pandera exists for the step before that assumption is safe to make, validating that a DataFrame actually matches the schema you expect, before a silently-wrong column ships into a report or a training set.
Python Code — a Pandera schema, works on Pandas or Polars:
import pandera as pa from pandera.typing import Series
class OrderSchema(pa.DataFrameModel): order_id: Series[int] revenue: Series[float] = pa.Field(ge=0) # revenue can't be negative region: Series[str] = pa.Field(isin=["NA", "EMEA", "APAC"])
OrderSchema.validate(df) # raises a clear SchemaError if any row breaks the rules
Pandera added Polars support in version 0.19 in early 2024 and has since extended validation to Dask, PySpark, and Ibis-backed tables too, using one schema definition regardless of which engine is actually running the DataFrame underneath. For a pipeline that feeds a model or a dashboard automatically, this is the difference between a bad upstream file throwing a clear, immediate error and silently corrupting a report that someone only notices weeks later.
Daft: when the data isn't just rows and columns anymore
The rest of this guide assumes structured, tabular data. Daft exists for the growing slice of work that doesn't fit that shape, images, audio, video, embeddings, and PDFs mixed in alongside ordinary columns.
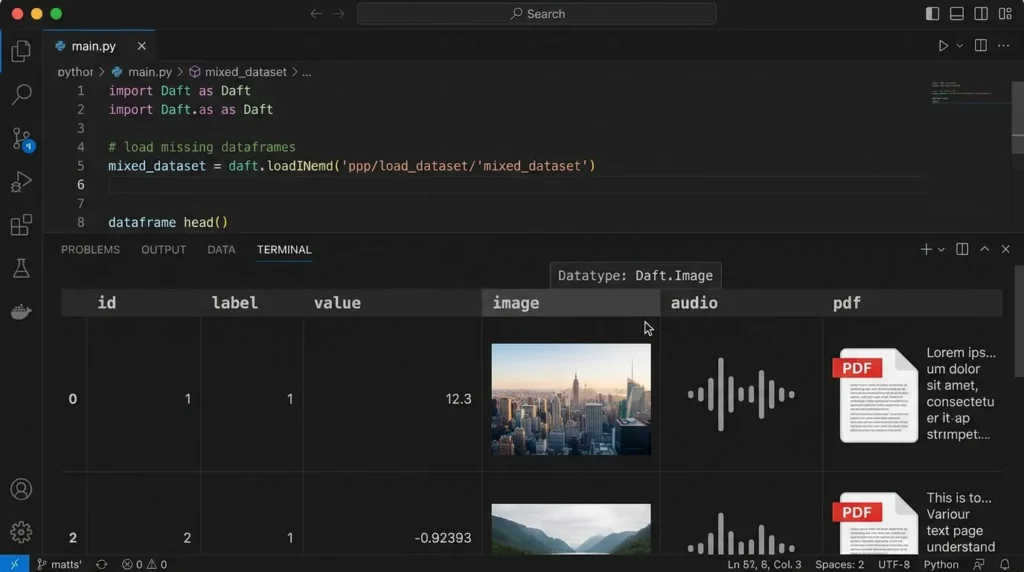
It's a distributed dataframe engine, built in Rust and native to Apache Arrow, that scales from a laptop to a Ray cluster without changing the code, and one of the clearest production references for it comes directly from Amazon: the company's own site states that Daft manages exabytes of Apache Parquet in Amazon's S3-based data catalog, improving the efficiency of one critical processing job by over 24% and saving more than 40,000 years of cumulative EC2 vCPU compute time annually.
Makes sense when: the dataset genuinely mixes structured columns with unstructured media, or the pipeline needs to scale past a single machine without adopting Spark. Not a replacement for Pandas or Polars on ordinary tabular data, it solves a different problem.
The Cloud Cost Angle Nobody Puts a Number On
Every comparison in this guide so far has measured speed. Speed matters, but the number that actually shows up in a budget review is dollars, and almost nobody connects the two directly, so here's the arithmetic.
Cloud compute cost for a data job comes down to two levers: how long the job runs, and how much memory you have to reserve to keep it from crashing. A slow, memory-hungry engine forces you to rent a bigger instance for longer. A faster, leaner one lets you rent a smaller instance for less time. Both levers move together whenever you swap Pandas for Polars or DuckDB, which is why the cost difference tends to be larger than the speed difference alone would suggest.
Using AWS's own published on-demand rates for memory-optimized instances in us-east-1, here's what the instance sizes referenced earlier in this guide actually cost to run:
| Instance | vCPUs | Memory | On-Demand Rate |
|---|---|---|---|
| r5.xlarge | 4 | 32 GiB | $0.252 / hr |
| r5.2xlarge | 8 | 64 GiB | $0.504 / hr |
| r5.4xlarge | 16 | 128 GiB | $1.008 / hr |
| r5.8xlarge | 32 | 256 GiB | $2.016 / hr |
Run the "Before and After" scenario from earlier through these rates, and the cost gap is bigger than the runtime gap. A job that needs a 256 GiB instance (r5.8xlarge) for 90 minutes costs about $3.02 per run at published on-demand pricing. Drop the same job to a 64 GiB instance (r5.2xlarge) for 15 minutes, a realistic outcome once a lazy, multi-core engine stops forcing you to over-provision memory, and the same run costs roughly $0.13.
That's not a rounding difference; it's a 95%+ cut per run, and it compounds every single time the job executes. A pipeline that runs nightly turns a roughly $1,100 annual compute bill into about $46, before anyone even talks about engineering time saved.
Independent measurement backs this up from a different angle, energy rather than dollars. A dedicated Polars energy consumption study found the engine used roughly 8x less energy than Pandas on large-DataFrame tasks, and only about 63% of the energy Pandas needed on TPC-H-style analytical queries. Less CPU time and less memory pressure show up as a smaller bill regardless of which cloud provider sends it.
DuckDB adds a second, structural kind of savings: because it's embedded and serverless, there's no cluster sitting idle between runs. One data infrastructure write-up summarized the pattern plainly, single-process DuckDB setup reading from object storage tends to deliver most of the practical benefit of a full cloud data warehouse at a fraction of the running cost, simply because you stop paying for compute capacity you're not actively using.
Some engineers now call this shift "cluster fatigue", a growing reluctance to spin up a distributed Spark cluster by default once a job crosses a size threshold that used to feel large but no longer does.
One independently published benchmark comparing DuckDB, Polars, and Spark head-to-head found that DuckDB actually beat Spark at low core counts, with Spark's advantage only opening up once resources scaled well past what a single sub-terabyte job typically needs, meaning the "default to Spark" instinct increasingly costs a cluster's worth of idle capacity for a job a single beefy instance could have handled.
That same benchmark is also an honest counterpoint to the DuckDB and Polars enthusiasm elsewhere in this guide: it found Spark's built-in memory spilling made it more resilient under memory pressure than Polars was at the time, which lines up with the out-of-core caveats covered earlier, the "just use DuckDB or Polars instead of Spark" instinct still has real limits worth testing against your own workload before committing to it.
The catch, and it's a real one: none of this accounts for the engineer-hours spent migrating a pipeline. A rewrite that saves $1,000 a year but costs two weeks of a senior engineer's time doesn't pay for itself quickly. This is the same math from the "Common Mistakes" section below, just expressed in the currency finance actually asks about.
Common Mistakes That Waste the Most Time
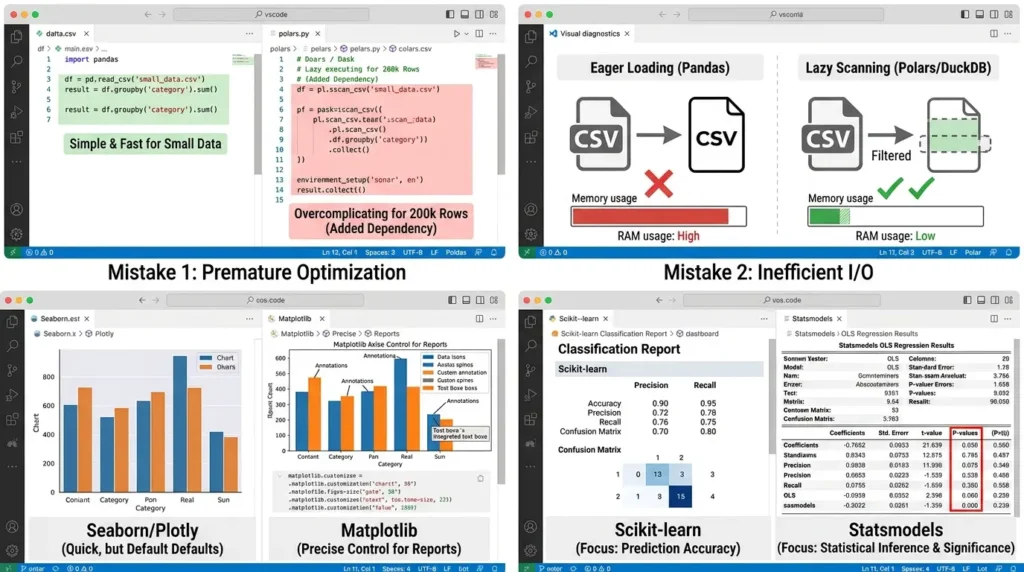
Migrating to Polars or Dask before the data actually demands it
The GitHub and Capital One case studies above both involve genuinely large, recurring, production-grade jobs. Applying the same migration to a 200,000-row weekly report adds a new dependency, a new API to learn, and a smaller community to debug against, for a speed difference nobody will notice.
Loading an entire CSV into Pandas just to filter it down to a fraction of the rows
This is the single most common source of "Pandas is too slow" complaints, and it's rarely actually a Pandas problem, it's an I/O problem. DuckDB or Polars' lazy scanning can push the filter down to the file read itself, so you're never loading the rows you were going to throw away.
Treating Matplotlib's verbosity as a reason to avoid it entirely
Seaborn and Plotly are faster to write, but for a chart that needs exact control, a specific figure size for a printed report, a precise annotation position, dropping down to Matplotlib is still faster than fighting a higher-level library's defaults.
Choosing scikit-learn for a problem that actually needs statistical inference
A model that predicts well isn't the same as a model whose coefficients you can defend in a meeting. If someone's going to ask "is this effect statistically significant," that question belongs to Statsmodels, not scikit-learn.
Try It: Which Library Fits Your Project?
Answer two questions and get a starting recommendation based on the trade-offs covered above.
Before and After: What Changes in Practice
Before: A mid-size analytics team runs its nightly reporting job in Pandas. The job reads twelve CSV files, filters and joins them, and writes a summary table. It takes 45 minutes on a memory-heavy instance, and twice a month it fails outright when a file is slightly larger than usual and the process runs out of RAM.
After: The same logic, ported to Polars with lazy evaluation and a DuckDB step for the final join against a lookup table, runs in under 6 minutes on a smaller instance, and the RAM failures disappear because neither tool loads the full dataset into memory before it needs to. Nothing about the business logic changed, only the engine underneath it.
That gap is the entire argument for learning more than one library in this space. The code you write barely changes; what changes is whether the tool underneath scales with the size of the problem you actually have.
Knowing when to switch between Pandas, Polars, DuckDB, and Dask is also a common Python interview question — our Data Engineering Interview Questions & Answersguide covers generators, chunking, the GIL, and large-file processing under the Python section
Frequently Asked Questions: Choosing Python data libraries
Is Polars going to replace Pandas?
Not for most workflows. Pandas 3.0 closed part of the performance gap and still has the deepest integration with the rest of the Python data ecosystem — Matplotlib, Seaborn, scikit-learn. Polars wins clearly once data size or run time becomes the actual bottleneck, which is a real but specific situation, not the default one.
Do I need to learn SQL to use DuckDB?
Yes, at least the basics — DuckDB's whole value is letting you write standard SQL against files and DataFrames. If you already know SQL from any other database, the DuckDB syntax will feel almost identical.
Can I use Dask and Polars together?
Not directly in the same pipeline step, since they solve different problems — Dask distributes existing Pandas-style code across machines, while Polars is a different engine entirely. Some teams use Polars for the heavy transform step and Dask only where a job needs to span multiple machines.
Is Seaborn just an easier version of Matplotlib?
Mostly, yes — Seaborn is built on top of Matplotlib and returns Matplotlib objects, so anything you can do in Matplotlib you can still do to a Seaborn chart. It trades some low-level control for much faster statistical plotting.
Why would I use Statsmodels instead of scikit-learn for a regression?
Because they answer different questions. Scikit-learn optimizes for prediction accuracy. Statsmodels gives you the statistical output — p-values, confidence intervals, standard errors — needed to argue that a relationship in the data is real and not noise.
Is Streamlit good enough for a real production tool, or just a prototype?
Both, depending on scope. Snowflake's own internal usage — over 500 Streamlit apps built by 70+ teams — is strong evidence it holds up well past the prototype stage for internal tools and dashboards. For a customer-facing product with heavy traffic, most teams still reach for a dedicated web framework.
What should a complete beginner start with?
Pandas and Matplotlib, in that order. Every other library in this guide either extends them, competes with them at scale, or assumes you already understand the concepts they teach.
How do I know when it's time to switch away from Pandas?
Watch for two symptoms: a job that used to take seconds now takes minutes, or a script crashing with a memory error on a file that isn't unusually large. Either one is the signal to benchmark Polars or DuckDB against your specific workload before committing to a rewrite.
What's the real difference between Ibis and just picking DuckDB or Polars directly?
Ibis adds a layer of indirection in exchange for portability. If you're confident you'll never change backends, that layer is pure overhead. It earns its cost specifically when a team expects to outgrow its first engine.
📋 Article Timeline & History
Successfully updated on October 2, 2026 with the latest details.
This article was originally published on August 13, 2026.

Was this article helpful?



[…] Choosing a Python Data Library in 2026: A Field Guide Beyond the Cheat Sheets […]